Responding to changing conditions
We’ve now created a lock-down advance function, but are currently triggering this function in an iterator based on a fixed number of days since the outbreak started.
A better approach would be to trigger the lock-down based on the number of individuals who are detected as infected in the model.
To do this, edit your lockdown.py script and copy in the following;
from metawards.iterators import iterate_working_week, \
                                advance_infprob, \
                                advance_fixed, \
                                advance_play

def advance_lockdown(**kwargs):
    print("We are on lockdown")
    advance_infprob(scale_rate=0.25, **kwargs)
    advance_play(**kwargs)

def iterate_lockdown(population, **kwargs):
    if not hasattr(population, "lockdown_state"):
        population.lockdown_state = "before"
        population.is_locked_down = False

    if population.lockdown_state == "before":
        if population.total > 5000:
            population.lockdown_state = "lockdown"
            population.lockdown_started = population.day
            population.is_locked_down = True

    if population.is_locked_down:
        return [advance_lockdown]
    else:
        return iterate_working_week(population=population,
                                    **kwargs)
The first thing we do here is see if the population has a
lockdown_state variable using the standard Python
hasattr function.
This variable won’t exist on the first call to
to iterate_lockdown, and so here we
set the lockdown_state to before
and set the flag population.is_locked_down to False.
Next, we check if the lockdown is in the before state. If it is,
then if the total infected population is greater than 5000 we change
the lockdown_state to lockdown, save the day the lockdown
started to population.lockdown_started, and set the flag
population.is_locked_down to True.
Finally, we either return our advance_lockdown advance function,
or the standard advance functions for a working week depending
on the value of the population.is_locked_down flag.
Run the model and draw the overview graph using;
metawards -d lurgy3 --additional ExtraSeedsLondon.dat --iterator lockdown
metawards-plot -i output/results.csv.bz2 --format jpg --dpi 150
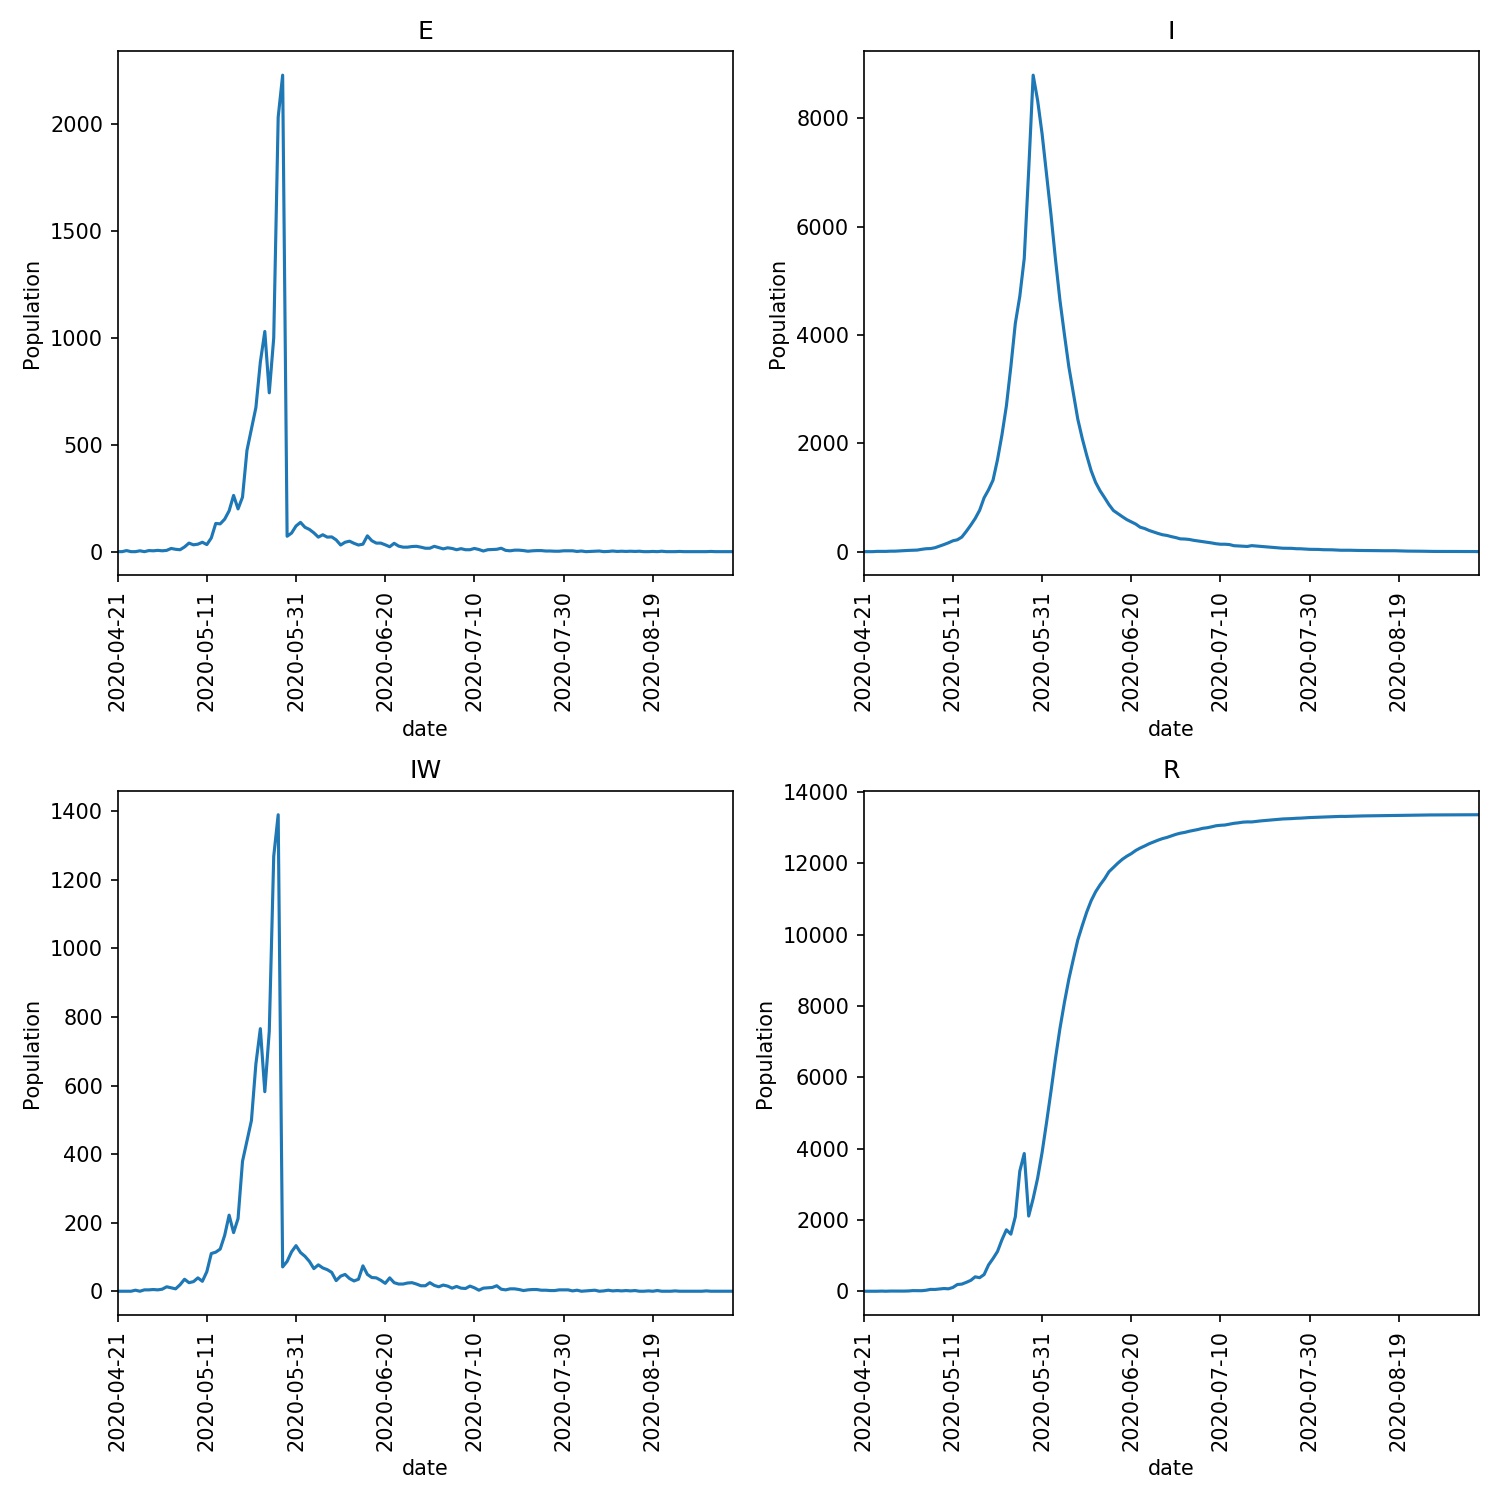
You should now see that the lockdown takes effect some time after the infected population grows above 5000. This tips the curve and reduces the spread of the disease. You can see what my graphs looked like here;
Releasing lockdown
We can use the data in population to decide when to release the
lockdown as well. For example, we could release when the size of the
infected population drops below 2000. To do this, edit your lockdown.py
file to read;
from metawards.iterators import iterate_working_week, \
                                advance_infprob, \
                                advance_fixed, \
                                advance_play

def advance_lockdown(**kwargs):
    print("We are on lockdown")
    advance_infprob(scale_rate=0.25, **kwargs)
    advance_play(**kwargs)

def iterate_lockdown(population, **kwargs):
    if not hasattr(population, "lockdown_state"):
        population.lockdown_state = "before"
        population.is_locked_down = False

    if population.lockdown_state == "before":
        if population.total > 5000:
            population.lockdown_state = "lockdown"
            population.lockdown_started = population.day
            population.is_locked_down = True

    elif population.lockdown_state == "lockdown":
        if population.total < 2000:
            population.lockdown_state = "after"
            population.lockdown_ended = population.day
            population.is_locked_down = False

    if population.is_locked_down:
        return [advance_lockdown]
    else:
        return iterate_working_week(population=population,
                                    **kwargs)
Run the model as before and see what happens…
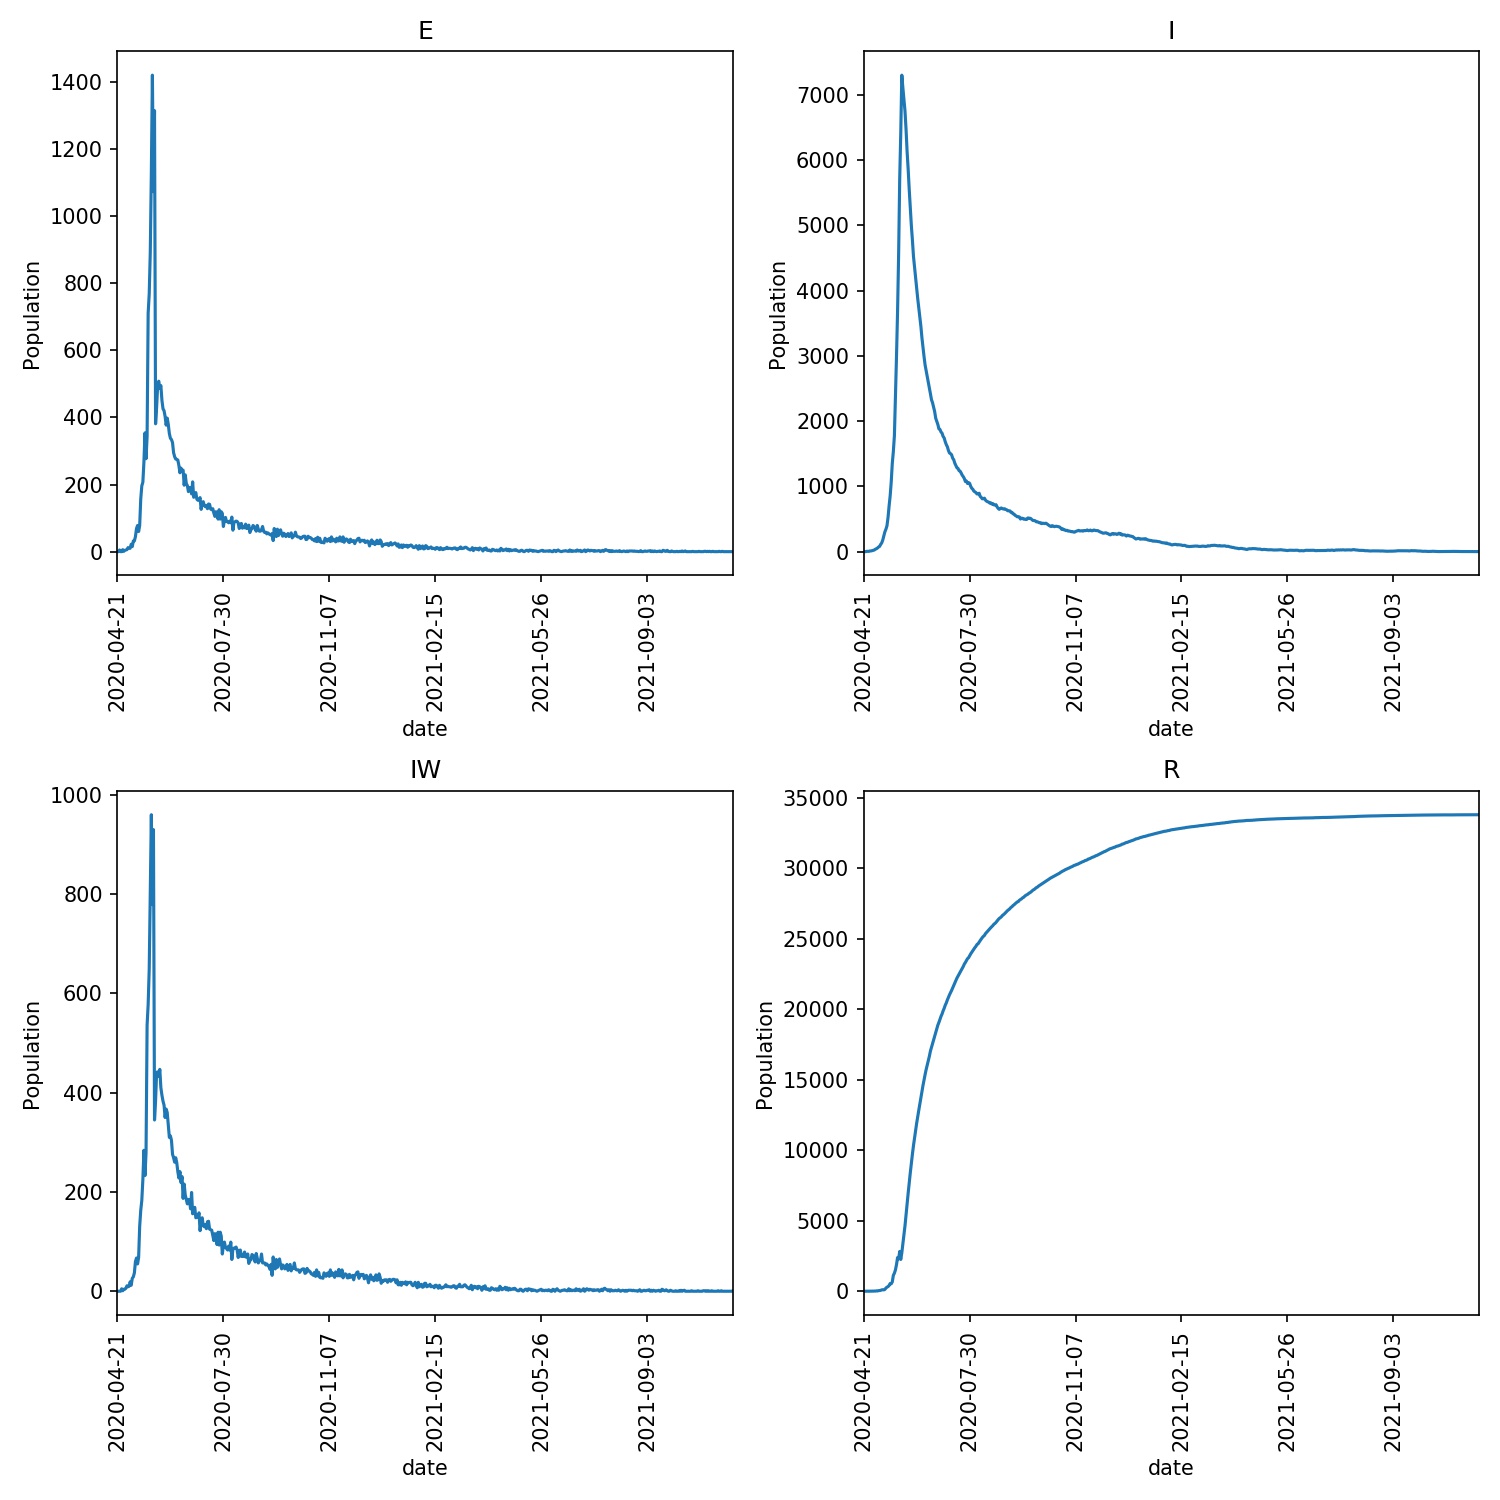
To start, the lockdown has worked and the number of infections has fallen, with the number falling below 2000 on day 78. However, releasing the lockdown completely leads to a rapid growth in the infection, with over 85,000 infected three weeks after lockdown ended. This is unsurprising, as there was still a lot of infected individuals remaining once lockdown ended, and a large population that was still susceptible to infection (as you can see from the print of my run and the overview graph below).
S: 56057097    E: 213    I: 2189    R: 22578    IW: 197   TOTAL POPULATION 56081864
We are on lockdown

76 2402
S: 56056905    E: 200    I: 2133    R: 22839    IW: 184   TOTAL POPULATION 56081877
We are on lockdown

77 2333
S: 56056746    E: 192    I: 2101    R: 23038    IW: 157   TOTAL POPULATION 56081885
We are on lockdown

78 2293
S: 56056568    E: 159    I: 2061    R: 23289    IW: 176   TOTAL POPULATION 56081918
We are on lockdown

79 2220
S: 56056399    E: 178    I: 1983    R: 23517    IW: 162   TOTAL POPULATION 56081899

80 2161
S: 56055290    E: 169    I: 1904    R: 24714    IW: 942   TOTAL POPULATION 56081908

81 2073
S: 56054625    E: 1109    I: 1853    R: 24490    IW: 596   TOTAL POPULATION 56080968

82 2962
S: 56053957    E: 665    I: 2728    R: 24727    IW: 602   TOTAL POPULATION 56081412

83 3393
S: 56052602    E: 668    I: 3162    R: 25645    IW: 1151   TOTAL POPULATION 56081409

84 3830
S: 56051035    E: 1355    I: 3601    R: 26086    IW: 1304   TOTAL POPULATION 56080722

85 4956
S: 56049197    E: 1567    I: 4689    R: 26624    IW: 1492   TOTAL POPULATION 56080510

86 6256
S: 56046897    E: 1838    I: 5977    R: 27365    IW: 1811   TOTAL POPULATION 56080239

87 7815
S: 56044064    E: 2300    I: 7445    R: 28268    IW: 2140   TOTAL POPULATION 56079777

88 9745
S: 56041777    E: 2833    I: 9318    R: 28149    IW: 1808   TOTAL POPULATION 56079244

89 12151
S: 56039009    E: 2287    I: 11558    R: 29223    IW: 2106   TOTAL POPULATION 56079790

90 13845
S: 56033706    E: 2768    I: 13086    R: 32517    IW: 3391   TOTAL POPULATION 56079309

91 15854
S: 56027735    E: 5303    I: 14968    R: 34071    IW: 3622   TOTAL POPULATION 56076774

92 20271
S: 56020915    E: 5971    I: 19179    R: 36012    IW: 3947   TOTAL POPULATION 56076106

93 25150
S: 56012334    E: 6820    I: 23835    R: 39088    IW: 4518   TOTAL POPULATION 56075257

94 30655
S: 56001786    E: 8581    I: 29059    R: 42651    IW: 4947   TOTAL POPULATION 56073496

95 37640
S: 55994025    E: 10548    I: 35825    R: 41679    IW: 4377   TOTAL POPULATION 56071529

96 46373
S: 55984596    E: 7761    I: 44092    R: 45628    IW: 4847   TOTAL POPULATION 56074316

97 51853
S: 55965009    E: 9429    I: 49023    R: 58616    IW: 6443   TOTAL POPULATION 56072648

98 58452
S: 55943662    E: 19587    I: 55002    R: 63826    IW: 6618   TOTAL POPULATION 56062490

99 74589
S: 55919882    E: 21347    I: 70325    R: 70523    IW: 6883   TOTAL POPULATION 56060730

100 91672
S: 55889466    E: 23780    I: 86623    R: 82208    IW: 7276   TOTAL POPULATION 56058297
Note how the second wave of infection makes the initial wave almost invisible in this graph. The only visible evidence is the small peak in the number of infected wards (IW) plot.
Relaxing, not removing lockdown
The problem is that we treated lockdown like a binary switch, and immediately went back to normal once it was lifted.
Instead, we need to release the lockdown in stages. To model this,
edit your lockdown.py to contain the following.
from metawards.iterators import iterate_working_week, \
                                advance_infprob, \
                                advance_fixed, \
                                advance_play

def advance_lockdown(population, **kwargs):
    print(f"We are on lockdown ({population.lockdown_scale_rate})")
    advance_infprob(scale_rate=population.lockdown_scale_rate,
                    **kwargs)
    advance_play(population=population, **kwargs)

def iterate_lockdown(population, **kwargs):
    try:
        population.lockdown_state
    except Exception:
        population.lockdown_state = "before"
        population.is_locked_down = False
        population.lockdown_scale_rate = 0.05

    if population.lockdown_state == "before":
        if population.total > 5000:
            population.lockdown_state = "lockdown"
            population.lockdown_started = population.day
            population.is_locked_down = True

    elif population.lockdown_state == "lockdown":
        if population.total < 2000:
            population.lockdown_state = "relaxed_lockdown"
            population.lockdown_ended = population.day
            population.lockdown_scale_rate = 0.10
            population.is_locked_down = True

    elif population.lockdown_state == "relaxed_lockdown":
        if population.total < 1000:
            population.lockdown_scale_rate = 0.20
        else:
            population.lockdown_scale_rate = 0.10

    if population.is_locked_down:
        return [advance_lockdown]
    else:
        return iterate_working_week(population=population,
                                    **kwargs)
In this code we have created a new lockdown state that we’ve called
relaxed_lockdown. This is entered when the number of infections
drops below 2000. In this state controls can be released that
correspond to now only halving the infection rate (scale_rate
is increased to 0.10 from 0.05 during the strong lockdown).
In the relaxed_lockdown state the infected population
is always checked. If it is below 1000 then the lockdown can be
relaxed even more, with the scale_rate increasing from 0.10
to 0.20. However, if the infected population rises above 1000,
then the lockdown is tightened and the scale_rate is lowered
again to 0.10.
Have a go at running using this iterator. What do you see? In my
case I see the model moving from lockdown (scale_factor==0.05),
through relaxed lockdown (scale_factor==0.1) to light
lockdown (scale_factor==0.2) during the outbreak, which
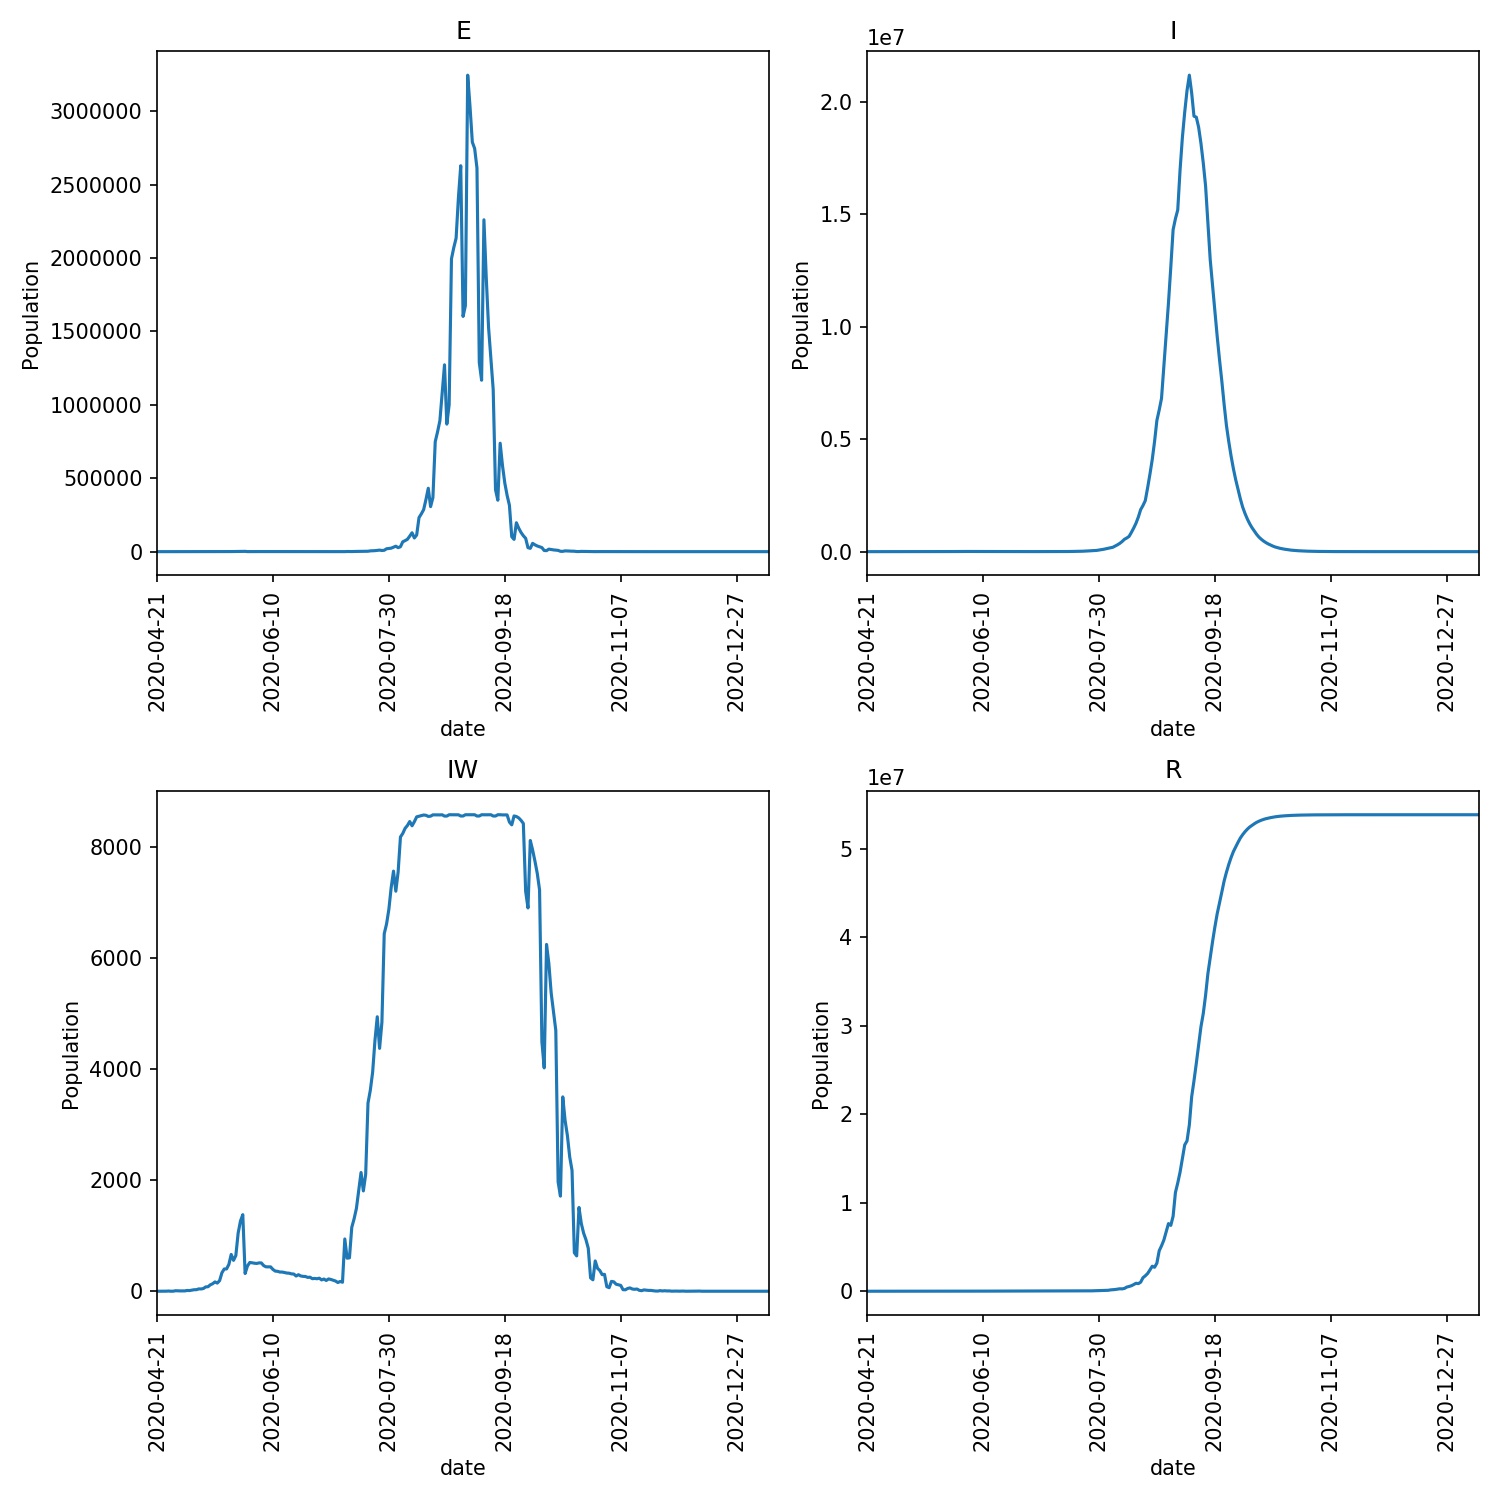
is brought under control. The overview plots are here;
There is a small second peak as the lockdown is relaxed, but this seems to be under control.
Warning
Remember, we cannot read too much into single model runs as these are very stochastic simulations. We would need to run models many times and average before we could gain real insight.
Returning to work
Because Python is dynamically typed, we can set whatever flags
or add whatever data we want to the population object that
we need (or indeed to any Python object).
Let’s now add an extra flag that will be used by
advance_lockdown to call advance_fixed if the lockdown
has been lifted sufficiently for people to return to work.
Copy the below into your lockdown.py file;
from metawards.iterators import iterate_working_week, \
                                advance_infprob, \
                                advance_fixed, \
                                advance_play

def advance_lockdown(population, **kwargs):
    print(f"We are on lockdown ({population.lockdown_scale_rate})")
    print(f"is_work_locked_down == {population.is_work_locked_down}")
    advance_infprob(scale_rate=population.lockdown_scale_rate,
                    **kwargs)

    advance_play(population=population, **kwargs)

    if not population.is_work_locked_down:
        advance_fixed(population=population, **kwargs)

def iterate_lockdown(population, **kwargs):
    if not hasattr(population, "lockdown_state"):
        population.lockdown_state = "before"
        population.is_locked_down = False

    if population.lockdown_state == "before":
        if population.total > 5000:
            population.lockdown_state = "lockdown"
            population.lockdown_started = population.day
            population.is_locked_down = True
            population.lockdown_scale_rate = 0.05
            population.is_work_locked_down = True

    elif population.lockdown_state == "lockdown":
        if population.total < 2000:
            population.lockdown_state = "relaxed_lockdown"
            population.lockdown_ended = population.day
            population.lockdown_scale_rate = 0.05
            population.is_locked_down = True
            population.is_work_locked_down = False

    elif population.lockdown_state == "relaxed_lockdown":
        population.is_work_locked_down = False

        if population.total > 5000:
            population.lockdown_state = "lockdown"
            population.lockdown_started = population.day
            population.is_locked_down = True
            population.lockdown_scale_rate = 0.05
            population.is_work_locked_down = True
        elif population.total < 1000:
            population.lockdown_scale_rate = 0.1
        else:
            population.lockdown_scale_rate = 0.05

    if population.is_locked_down:
        return [advance_lockdown]
    else:
        return iterate_working_week(population=population,
                                    **kwargs)
This is getting longer, but I hope you can see that all we have
added is a population.is_work_locked_down flag, plus some
extra code to flip this between True and False. This flag
is read by advance_lockdown, which calls advance_fixed
if the flag is False. We’ve also added a check to see if the
infected population rises above 5000 while in “relaxed lockdown”,
and if it does, to re-enter full lockdown.
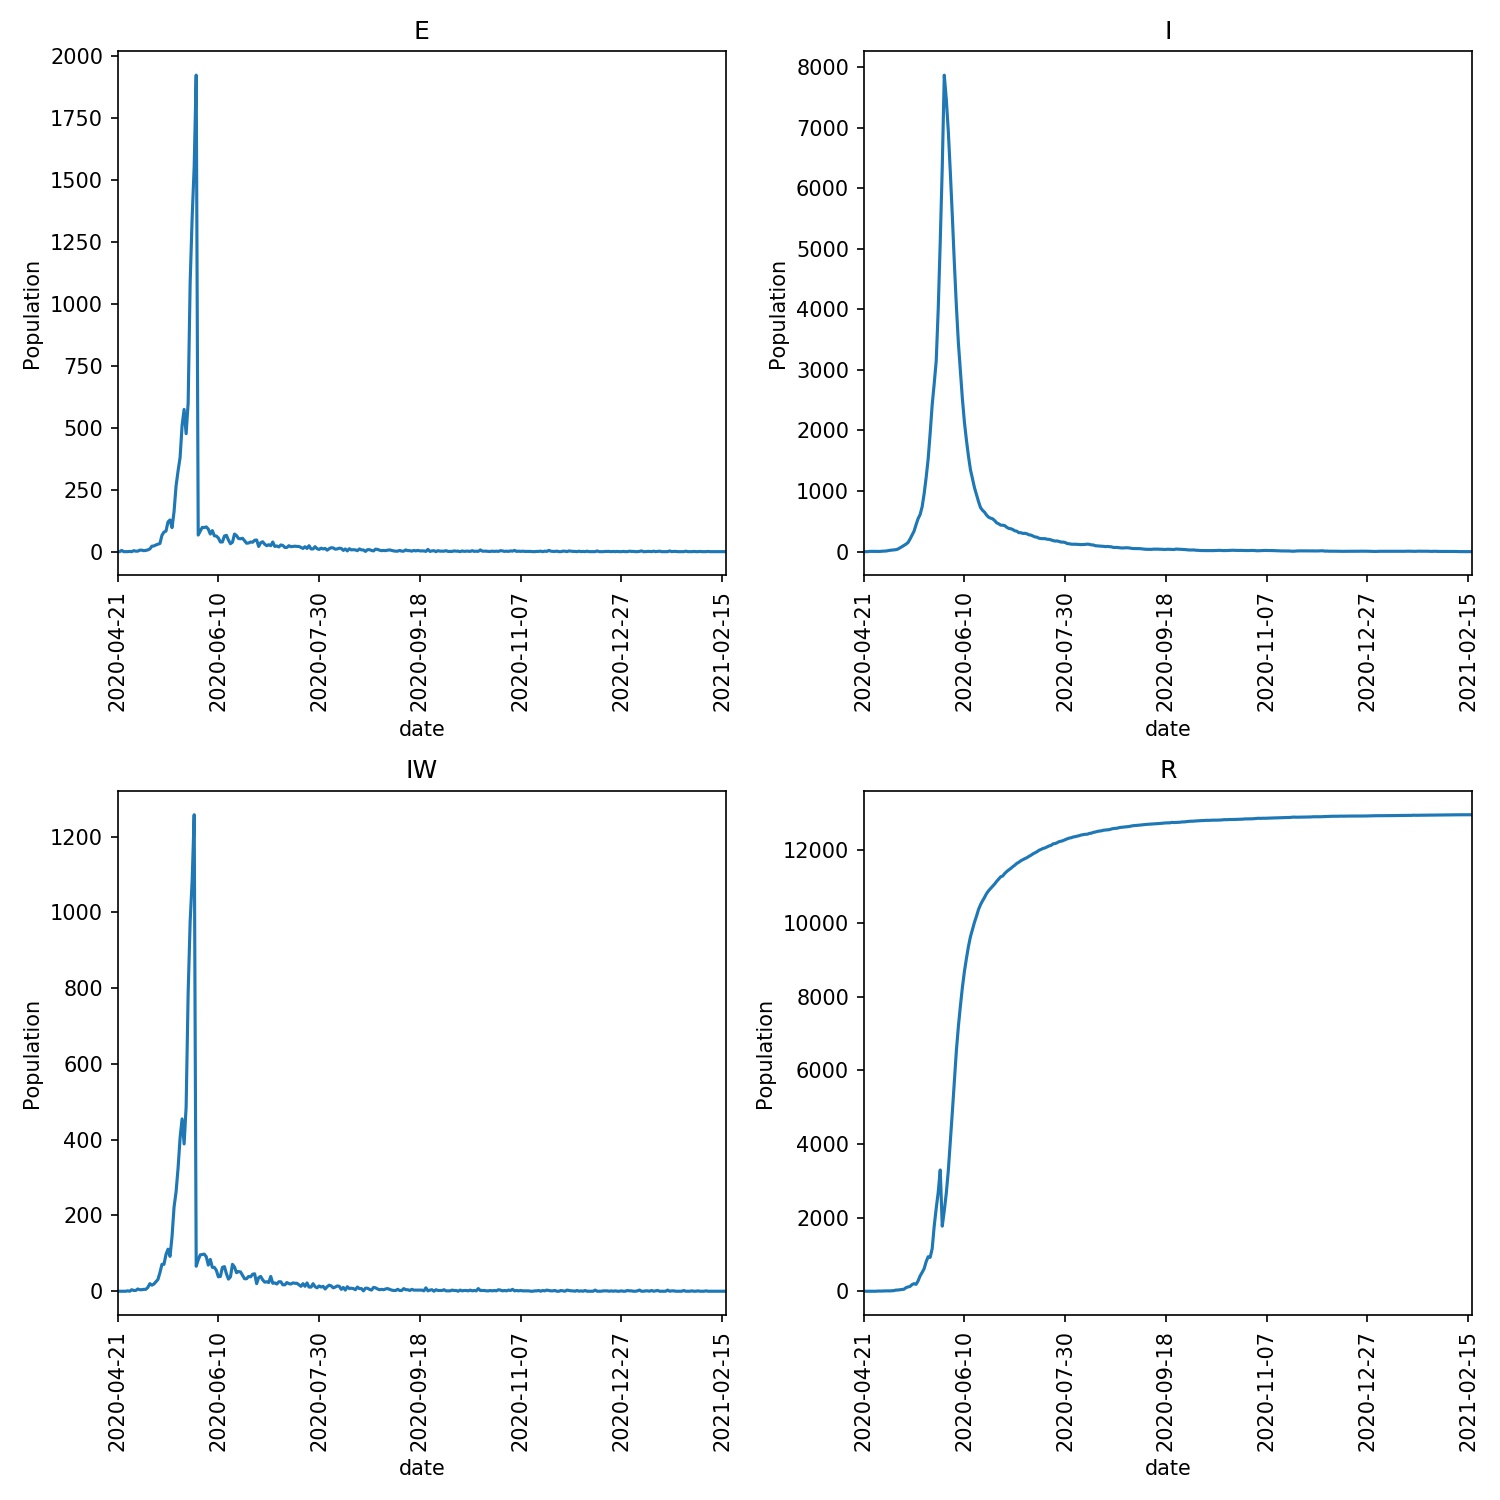
Run the model and plot the graphs. What do you see? Do you get a graph similar to below?