Extending the Model in the Console
Adding a disease stage
Continuing in the terminal/console from the last session, we will now extend
the disease to include an additional, less-infectious, semi-recovering stage,
which will come after I, and be called IR. We do this by inserting a new
stage, named “IR”, at index 2, with beta value 0.2, and progress
value 0.1. Edit your lurgy.json file to read;
{
  "name": "lurgy",
  "stage": ["E", "I", "IR", "R"],
  "beta": [0.0, 0.8, 0.2, 0.0],
  "progress": [0.5, 0.25, 0.1, 0.0]
}
We can now run the model again;
metawards --disease lurgy.json --model network.json --additional 100
We can now process and plot the results similarly to before, e.g.
metawards-plot -i output/results.csv.bz2
Repeating a run
MetaWards model runs are stochastic, meaning that they use random numbers. While each individual run is reproducible (given the same random number seed and number of processor threads), it is best to run multiple runs so that you can look at averages.
You can perform multiple runs using the repeats argument, e.g.
to perform four runs, you should type;
metawards --disease lurgy.json --model network.json --additional 100 --repeats 4
If you look at the results, you will that there is a repeat column, which indexes each run with a repeat number, e.g.
fingerprint,repeat,day,date,S,E,I,IR,R,IW,SCALE_UV
REPEAT,1,0,2020-07-22,10000,0,0,0,0,0,1.0
REPEAT,1,1,2020-07-23,9900,48,52,0,0,1,1.0
REPEAT,1,2,2020-07-24,9863,60,70,7,0,1,1.0
REPEAT,1,3,2020-07-25,9802,88,79,31,0,1,1.0
REPEAT,1,4,2020-07-26,9727,111,110,49,3,1,1.0
REPEAT,1,5,2020-07-27,9637,142,135,78,8,1,1.0
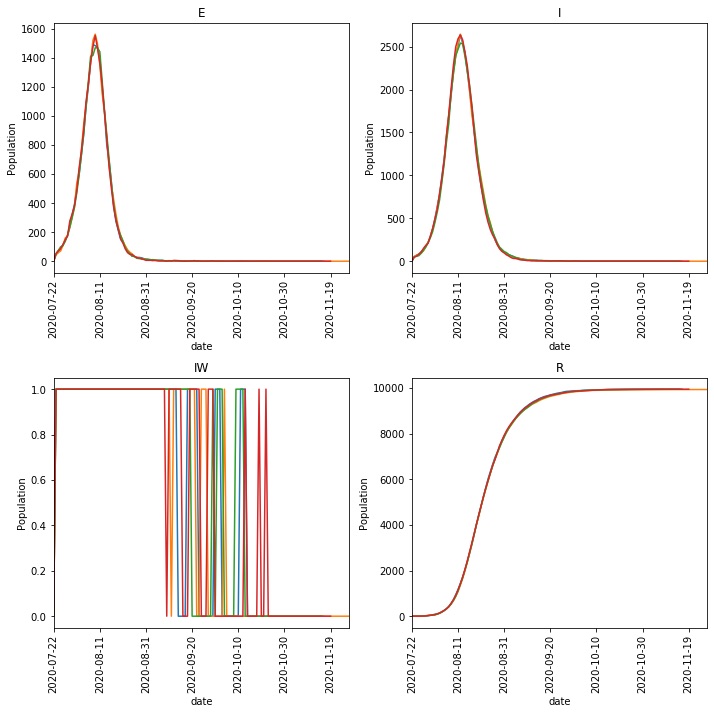
The metawards-plot command will automatically graph these repeats, e.g.
metawards-plot -i output/results.csv.bz2
You should get a resulting image (output/overview.png)
that looks something like this;
Note
You will need to load the data into Python pandas, R or Excel to visualise more data, as metawards-plot is limited in its visualisation capabilities.
Adding more wards
Next, we will extend the model by adding more wards. We will model home,
work and school, so let’s now add the work and school wards.
Edit your network.json file to read;
[
  {
    "id": 1,
    "info": {
        "name": "home"
    },
    "num_workers": 12500,
    "num_players": 10000,
    "workers": {
      "destination": [2, 3],
    "population": [7500, 5000]
    }
  },
  {
    "id": 2,
    "info": {
        "name": "work"
    }
  },
  {
    "id": 3,
    "info": {
        "name": "school"
    }
  }
]
Warning
Writing these network files by hand is quite difficult, and any small
errors will cause issues. It is much better to construct this file
using the Python or R API, and then save the file using the
metawards.Wards.to_json() function.
Note
The term worker is very broad in MetaWards. It means any individual that make regular, predictable movements each day. In this case, it refers to workers, teachers and students.
Running the model
We can now run the model. In this case, we want to seed the infection in
the home ward, so we need to pass this name into the additional
parameter.
metawards --disease lurgy.json --model network.json --additional "1, 100, home"
Note
The format is day number (in this case seed on day 1), then number to seed (seeding 100 infections), then ward name or number (in this case, home)
You will see a lot of output. MetaWards does print a table to confirm the seeding, e.g.
┏━━━━━┳━━━━━━━━━━━━━┳━━━━━━━━━━━━━━━━━━━━━━━━━━━━━━━━━━━━━━━━━━━━━━┳━━━━━━━━━━━┓
┃ Day ┃ Demographic ┃                     Ward                     ┃  Number   ┃
┃     ┃             ┃                                              ┃  seeded   ┃
┡━━━━━╇━━━━━━━━━━━━━╇━━━━━━━━━━━━━━━━━━━━━━━━━━━━━━━━━━━━━━━━━━━━━━╇━━━━━━━━━━━┩
│  1  │    None     │ 1 : WardInfo(name='home', alternate_names=,  │    100    │
│     │             │   code='', alternate_codes=, authority='',   │           │
│     │             │        authority_code='', region='',         │           │
│     │             │               region_code='')                │           │
└─────┴─────────────┴──────────────────────────────────────────────┴───────────┘
The results can be processed and visualised as before, e.g.
metawards-plot -i output/results.csv.bz2