Features
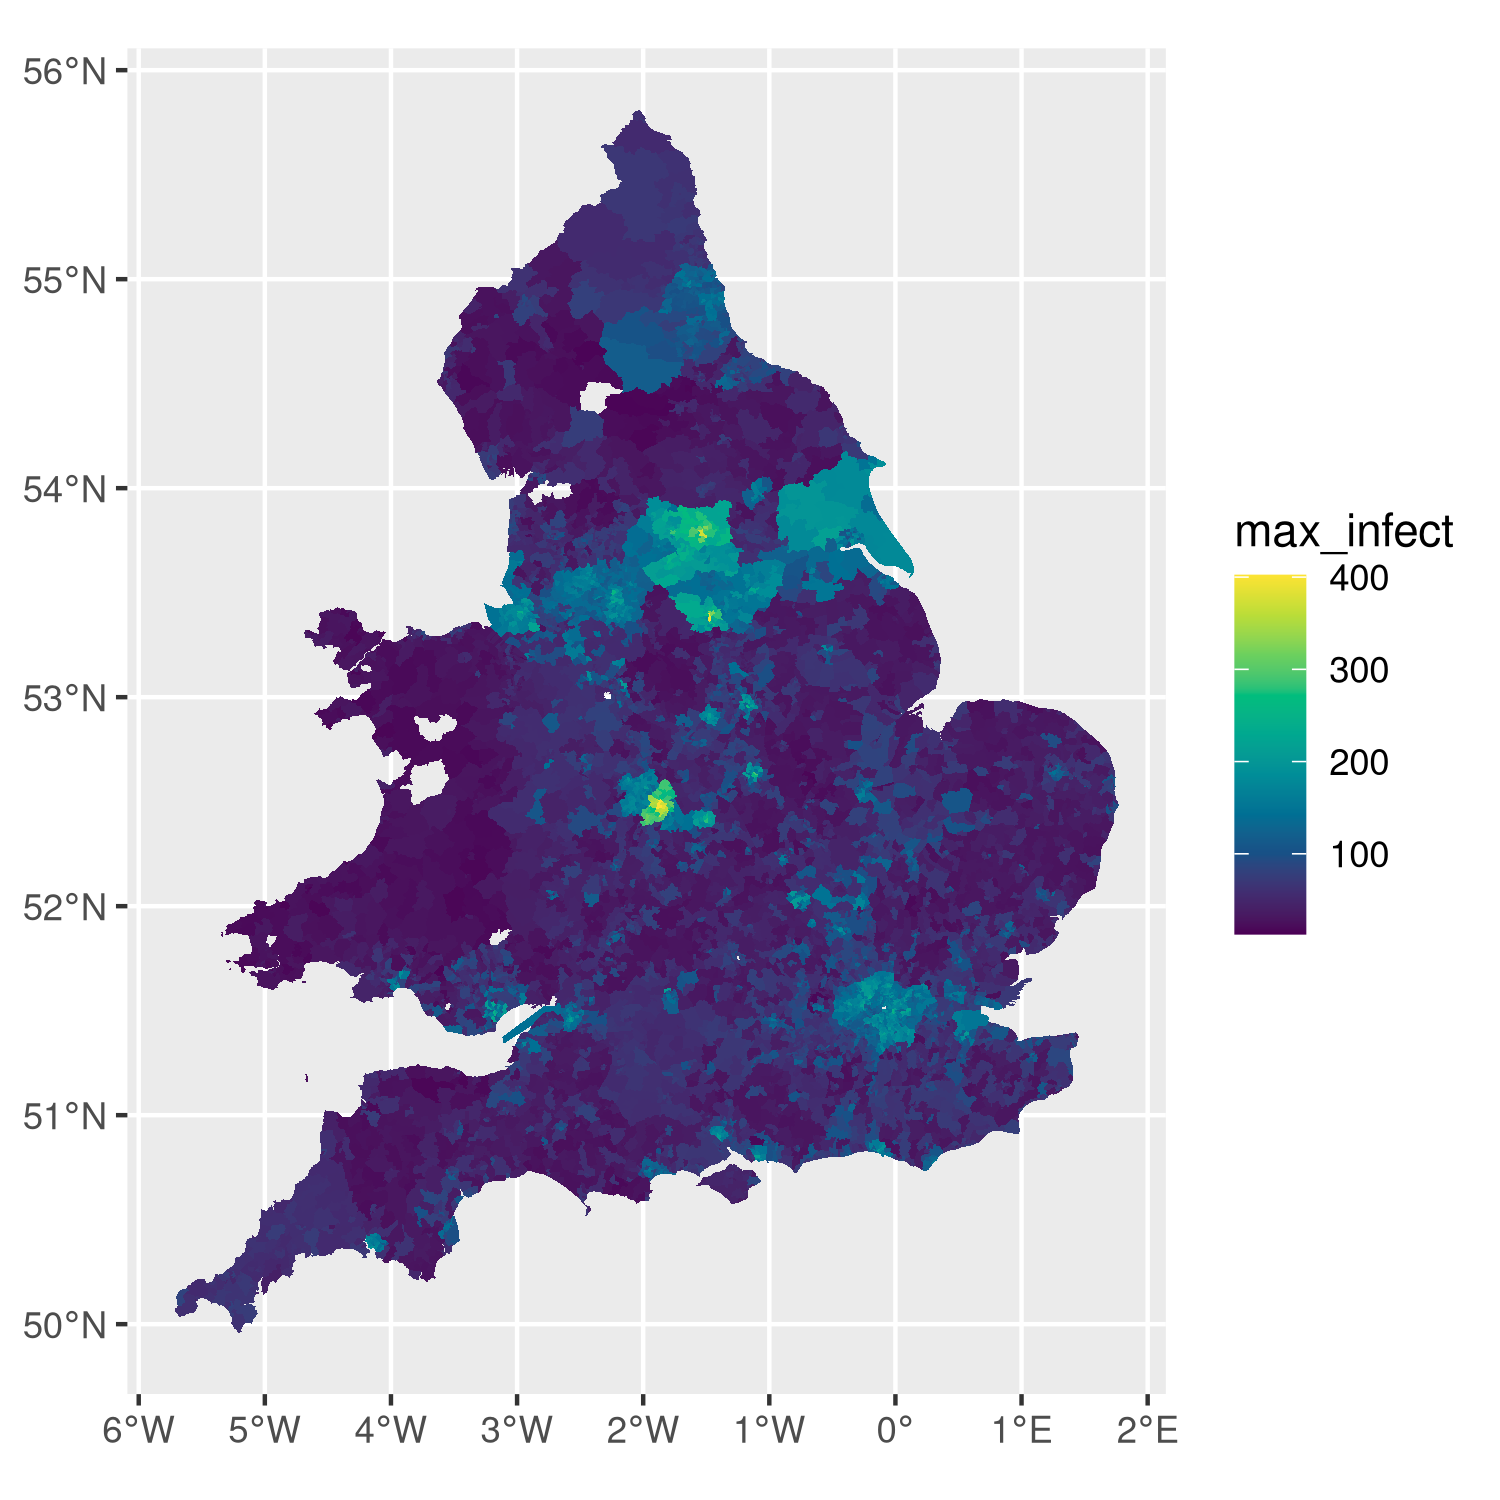
Analysis of a simulation run that used MetaWards to chart disease spread across England and Wales.
MetaWards is a SIR-based metapopulation disease modelling program. The software models individuals who move as metapopulations between home wards and work (or play) wards. This is a highly flexible program, that can model custom geographies, networks, diseases and demographics. You can use MetaWards directly from within Python (including Jupyter), R (including RStudio) or from the command line (terminal / console).
For more information, take a look at the quick start guide.
The program is designed to enable researchers to model how an infection may spread, and what impact different control measures or individual behaviours may make.
To this end, MetaWards features;
Multiple connected networks enable complex scenarios to be modelled
a flexible plugin architecture that makes it easy to implement new control measures. For example, the tutorial shows how this can be used to model shielding, different lockdown scenarios and to investigate necessary durations of quarantine or self-isolation.
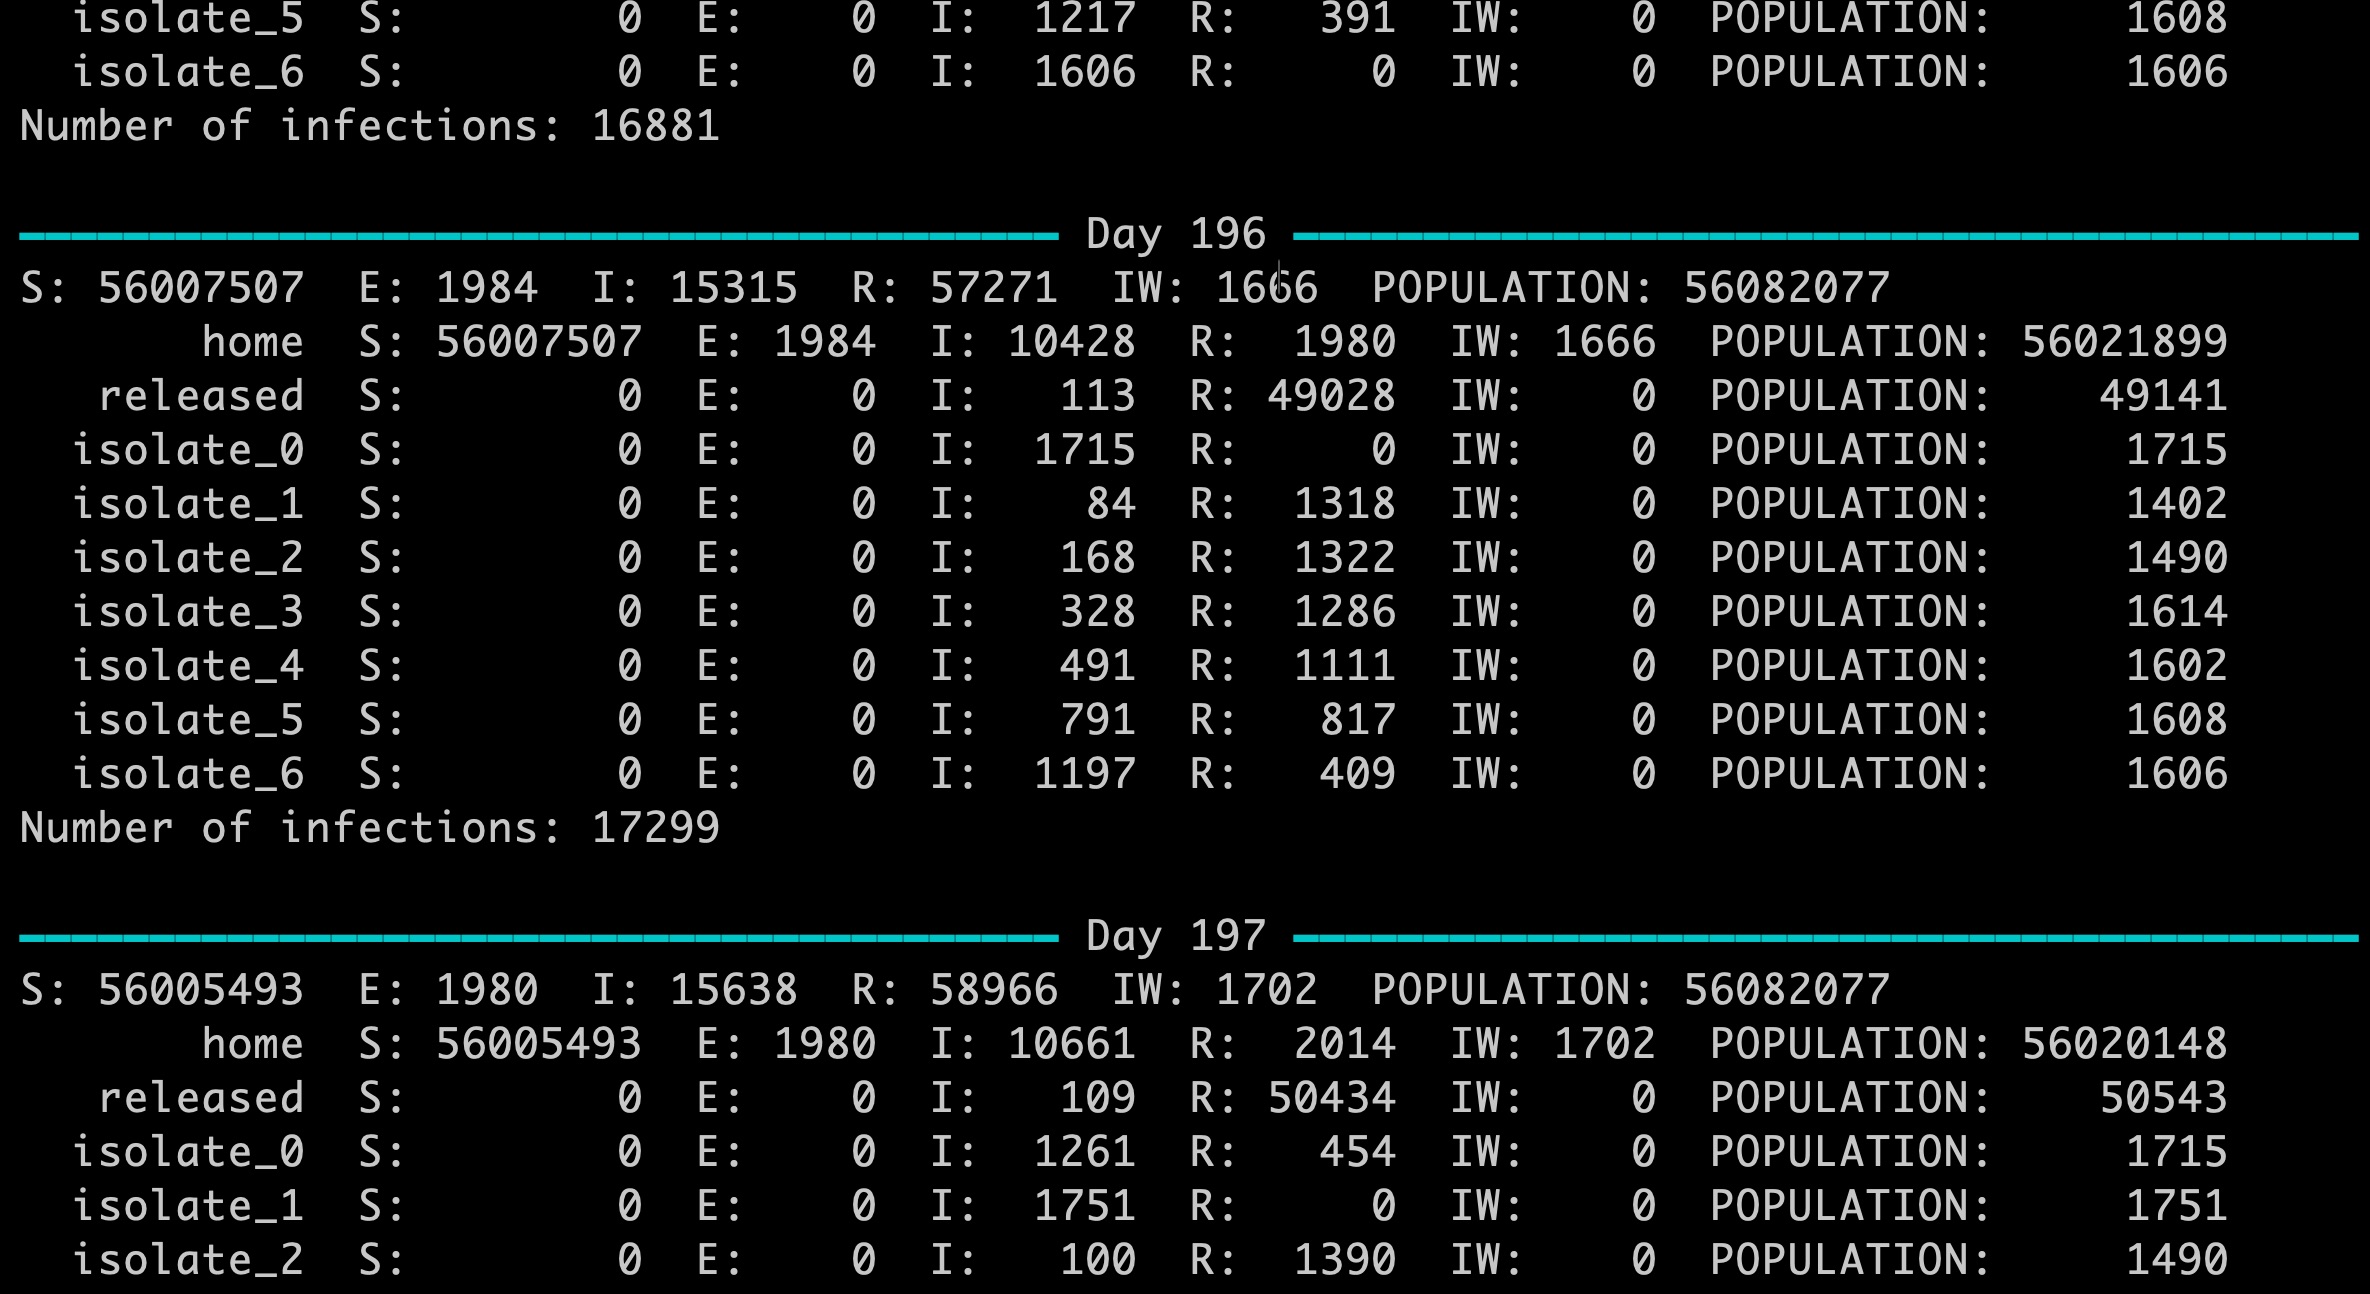
multi-network demographic support. Multiple networks can be run as a single combined group, with custom plugins used to merge data between networks, and conditionally move individuals between different demographics. We’ve used to model shielding and self-isolation, hospital admissions, impact of individuals returning from holidays etc.
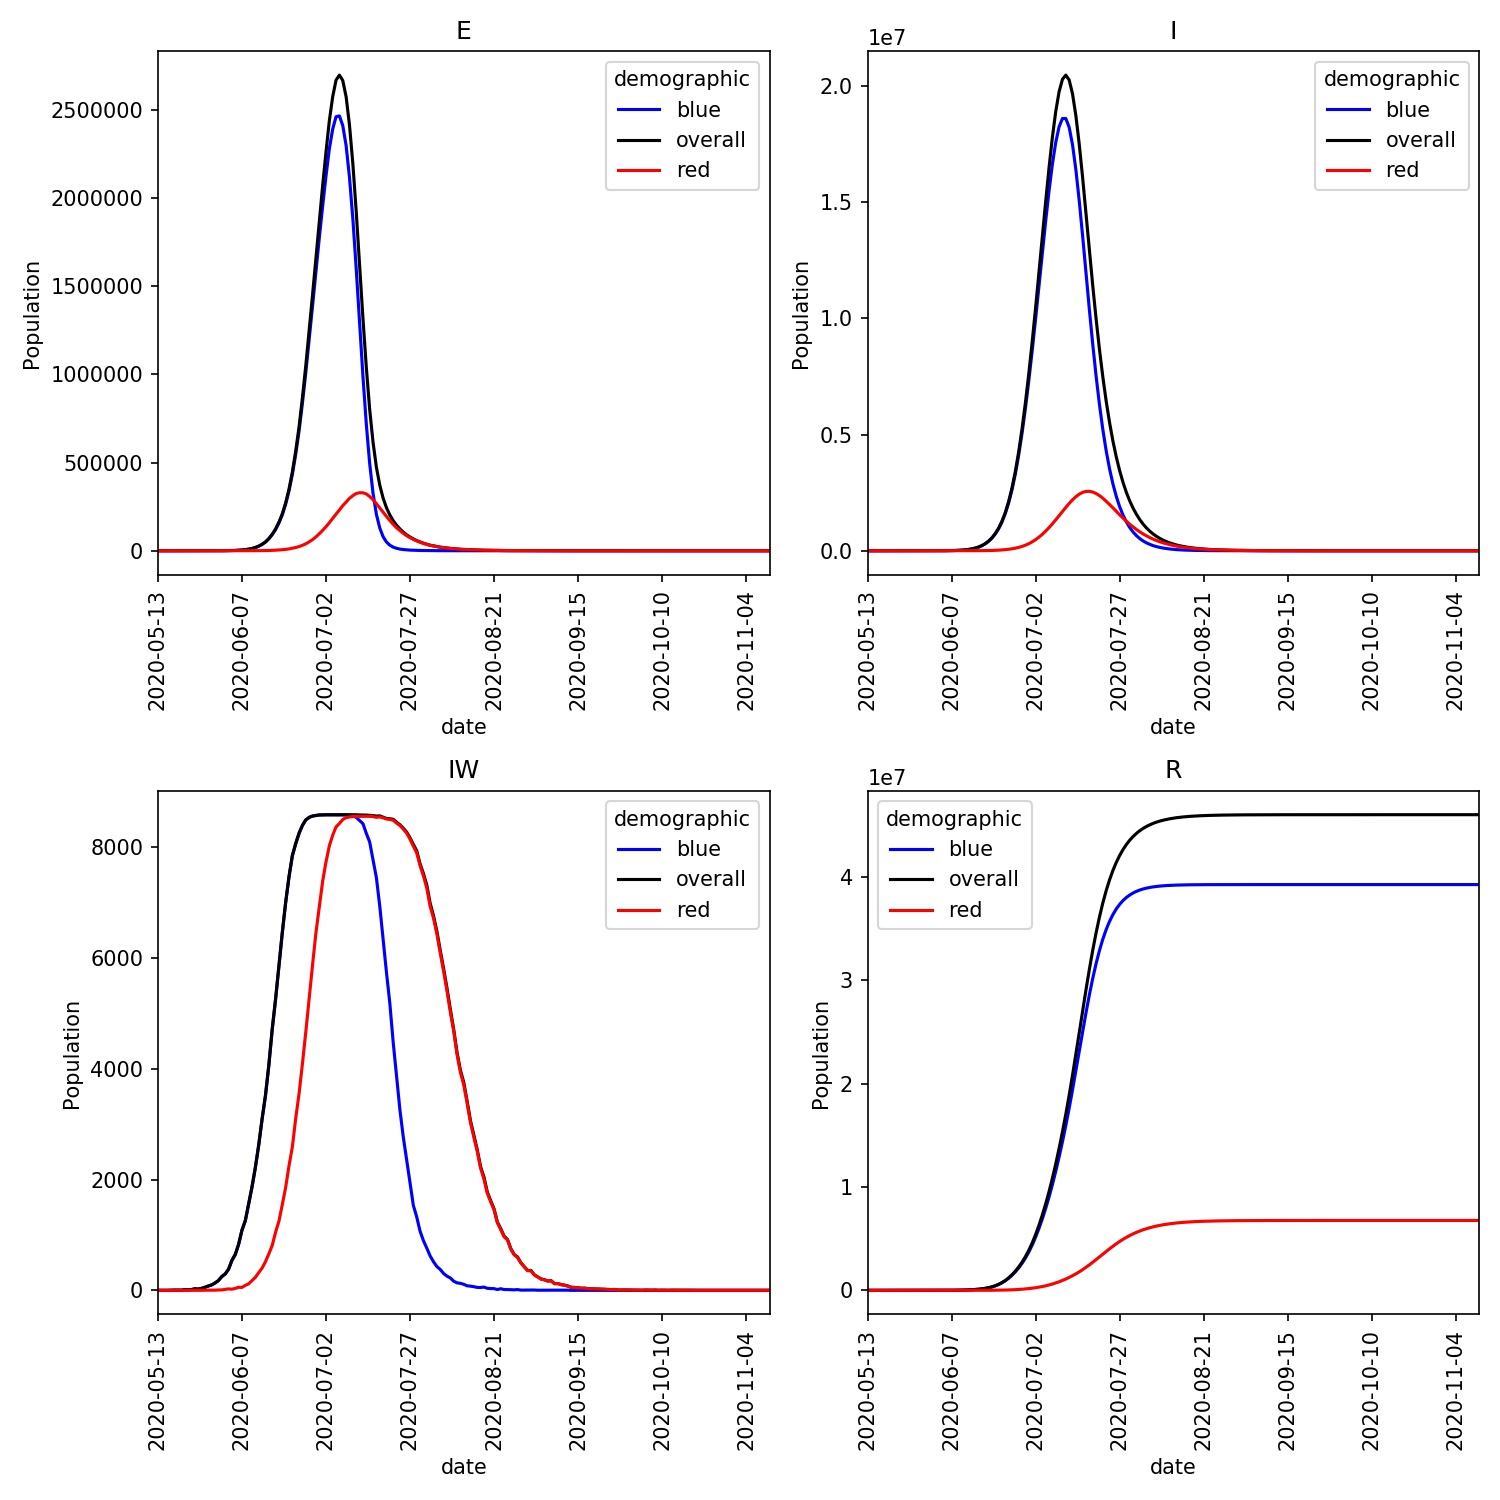
Built in metawards-plot tool for rapid visualisation of results, including across multiple networks
per-ward custom parameter support. Different wards can have different parameters, meaning that you can easily model local behaviour (e.g. local lockdowns, changes in local control measures etc.).
complete-detail and full control over horizontal and vertical movements through disease stages or across demographics. We’ve used this to model vaccination and also to model waning immunity, with individuals returned from the R or V stages back to S.
flexible data output support - again handled using an array of in-built or user-supplied data extraction plugin functions. Output the data you need in the format you want to perform analysis.
full reproducibility support baked in throughout. The code records enough data to make reproduction easy, with results designed to be the same given the same inputs, random number seed and number of threads.
a complete tutorial that takes you from beginning to learn how to run SIR simulations, to writing powerful plugins that let you model complex scenarios.
support for scanning design files for optimisation or sensitivity analysis of nearly all input parameters, plus any user custom parameters used in the main code or any plugins. These scans can use as much compute you have available, parallelising individual runs over multiple cores, and scaling multiple runs up to full supercomputers (if you are lucky enough to have access to one)…
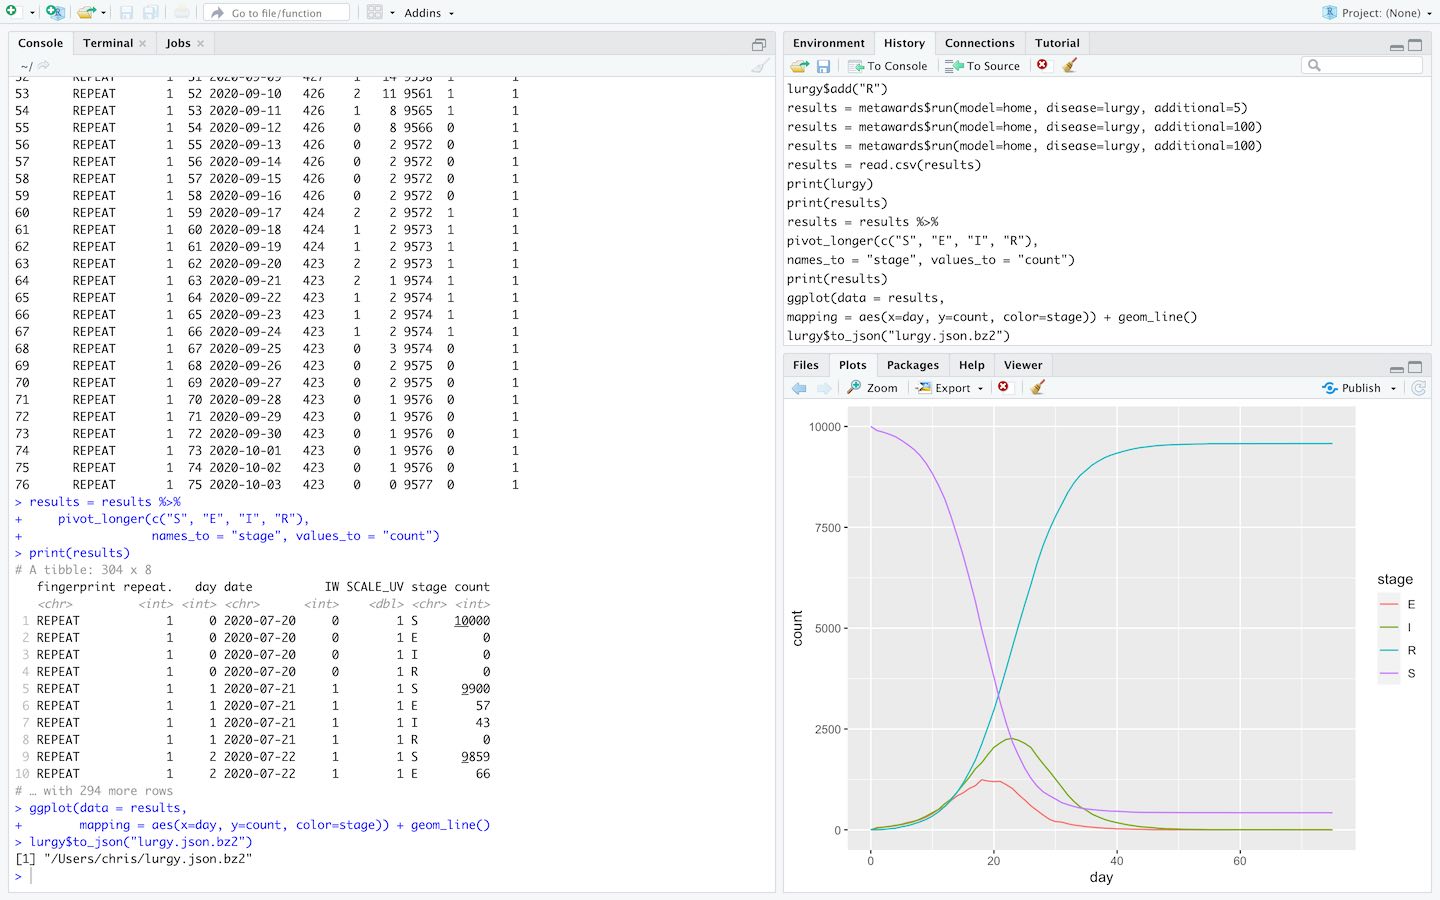
Run MetaWards and analyse results directly within RStudio via the MetaWards R interface.
…but - the individual code is optimised and can run happily on small laptops. Individual national-scale networks fit in approximately 80 MB of memory, and model runs can take 15-90 seconds to perform. This scales with the number of demographics that are added, but high performance and low memory consumption are design goals. Models using only a few wards are kilobytes, and take less than a second.
flexible input files that would enable modelling of any region or country to be undertaken (subject to good input data). Models of the UK and England and Wales have been created, and a Python and R API are provided to make it easy to create custom networks. These can model everything from individual wards or local geographies, up to full national- or international-scale metapopulation models.
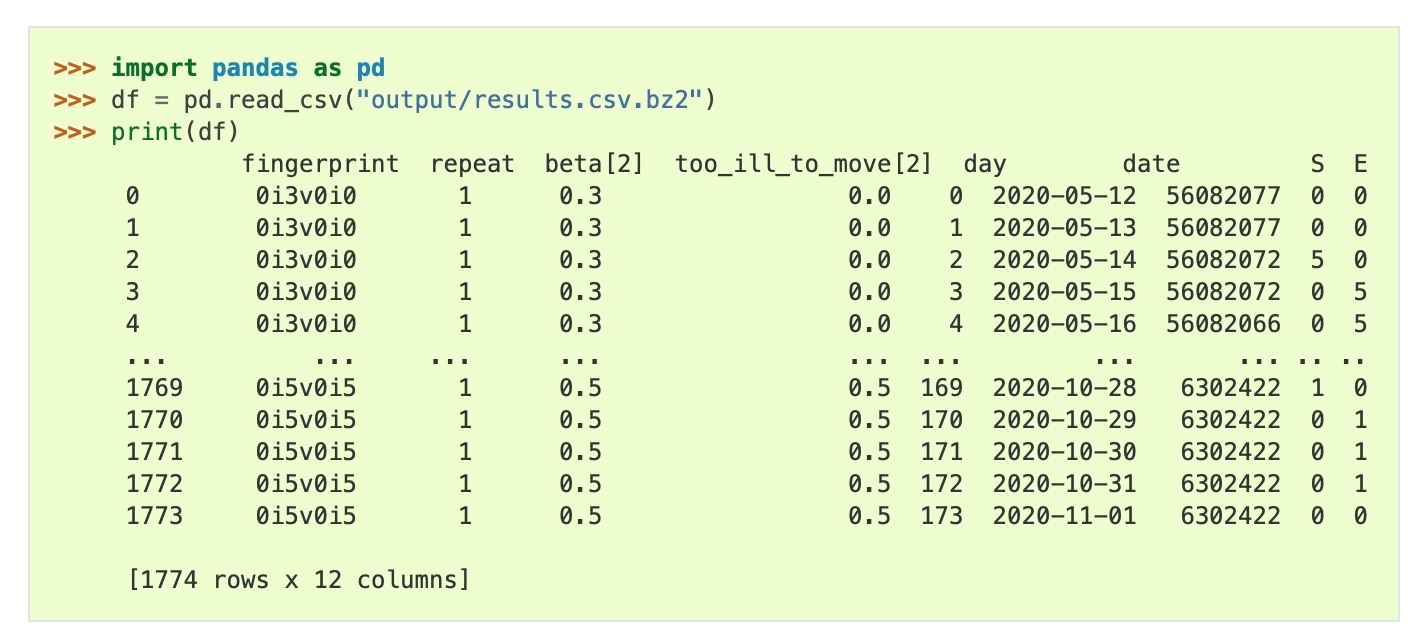
Easily load compressed data files into pandas, R or Excel for analysis
a colourful, modern and informative console output, with full unicode support and progress indicators. All outputs are duplicated to text files to ensure that no data from a run is lost.
both command-line and API interfaces. Feel free to run MetaWards as a standalone program, or to use the Python or R API to embed it as part of a larger framework. A modular, robust design has been used, so feel free to take and re-use the parts of MetaWards that are most of use to you.
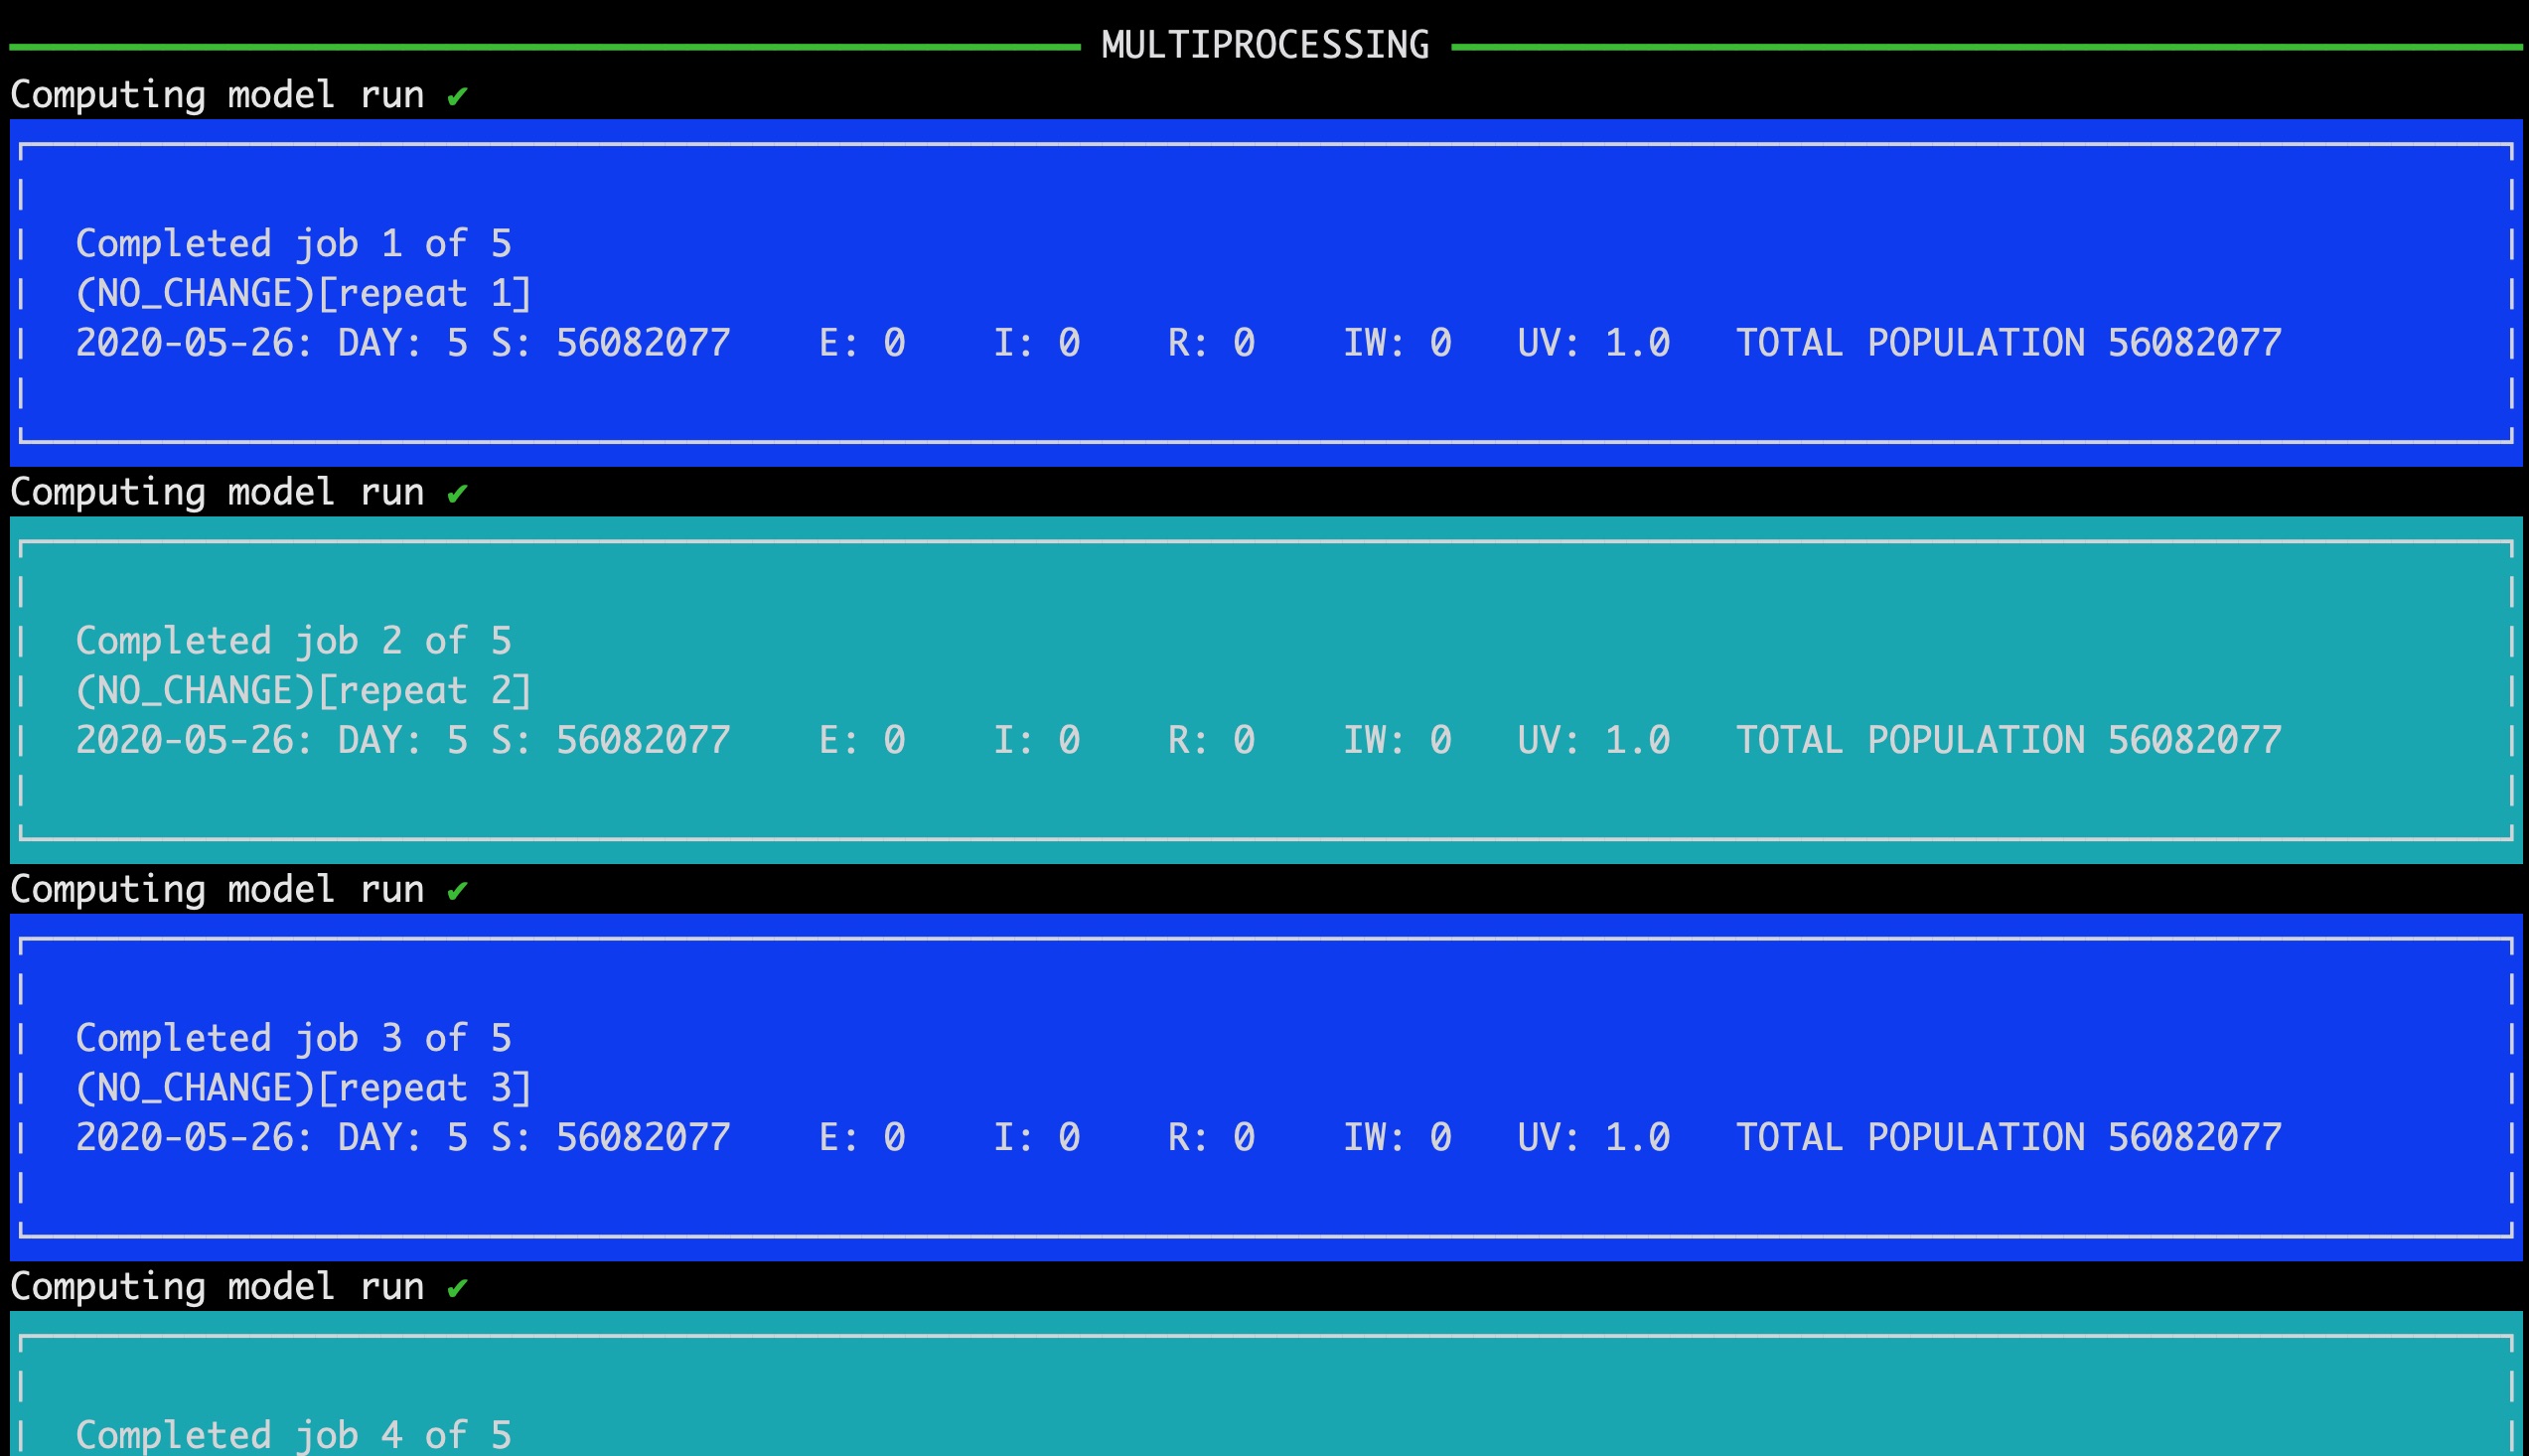
Perform multiple runs in parallel, with live summary updates as jobs finish
Software design
MetaWards is a modern piece of software that has been engineered following recognised best practice, e.g. using a modular design, lots of documentation, copious run-time and unit tests, and following a “tutorial-driven” development philosophy.
The software is mostly Python, with C used (via cython) to accelerate key parts. An R interface is provided via reticulate. The code is parallelised using OpenMP, with multiple model runs parallelised using multiprocessing, scoop or MPI, via mpi4py.
We take testing very seriously, and have lots of unit, integration and run-time tests. These are run as part of our CI/CD system deployed via GitHub Actions The code has in-built developer support for debug logging and profiling, with full API docs available that we hope will help new developers get quickly up to speed.
We also take versioning and backwards compatibility seriously. We follow the semantic versioning system for the main API, which should give confidence to anyone wanting to build on top of MetaWards. We also maintain compatibility of inputs and outputs, with the strong aim that all tutorials will be runnable, as-is, in future versions of the code.