Using custom merge functions to model shielding
So far you have modelled multiple demographics, but they either interacted fully with each other during an outbreak, or have not interacted at all.
One of the benefits of using demographics is that we can model different levels of interaction between different groups. To do this, we will need to set up an interaction matrix between demographics, and to call this via a custom mixer.
Interaction matrix
An interaction matrix specifies how much the force of infection (FOI) calculated from one demographic influences another. It is an asymmetric matrix, e.g. for our red and blue demographics it could be;
red |
blue |
|
|---|---|---|
red |
0.2 |
0.1 |
blue |
0.8 |
1.0 |
The diagonals of this matrix show how much infections in each demographic
affect that demographic, i.e. how easily the infection spreads within the
demographic. It has a similar affect to scale_uv, though is not
equivalent.
Note
scale_uv scales the precursor to the calculation of each ward’s day
and night FOIs, while the interaction matrix mixes the day and night
FOIs for each ward together.
The top-left value (0.2) says that red demographic is adopting lockdown measures that scale down the FOI between red individuals by 0.2.
In contrast, the bottom-right value (1.0) says that no measures are being taken within the blue demographic, and the FOI calculated from infections within that demographic are not scaled.
The top-right value (0.1) gives the amount by which the red demographic is affected by infections within the blue demographic. This describes how easily infections from the blue demographic can be transmitted to the red demographic. This low value of 0.1 indicates that care is taken by members of the blue demographic to not infect members of the red demographic.
The bottom-left value (0.8) is the reverse, namely how much the blue demographic is affected by infections within the red demographic, i.e. how easily infections from the red demographic can be transmitted to the blue demographic. The larger value of 0.8 indicates that the blue demographic are still being infected by members of the red demographic, e.g. perhaps because they are treating or caring for them and are thus exposed to large numbers of members.
The values in this matrix correspond to a potential shielding scenario, whereby measures are taken by the blue demographic to shield the red demographic from infection.
Custom mixers
We can use this interaction matrix by creating a custom mixer.
Create a file called shield.py and add the following;
from metawards.mixers import merge_using_matrix

def mix_shield(network, **kwargs):
    matrix = [ [0.2, 0.1],
               [0.8, 1.0] ]

    network.demographics.interaction_matrix = matrix

    return [merge_using_matrix]
Here we have created a new mixer called mix_shield. This function
has two purposes:
It sets
interaction_matrixequal to the desired interaction matrix in the networks’Demographicsobject. The matrix is as described above, and represents shielding of the red demographic by the blue demographic.It returns the
merge_using_matrix()merge function as the function to use to merge the FOIs.merge_using_matrix()reads the interaction matrix fromnetwork.demographics.interaction_matrix, meaning that the value set in step 1 will be used for the merge.
You set the mixer to use using the --mixer flag, e.g. run metawards
using;
metawards -d lurgy3 -D demographics.json -a ExtraSeedsLondon.dat --mixer shield
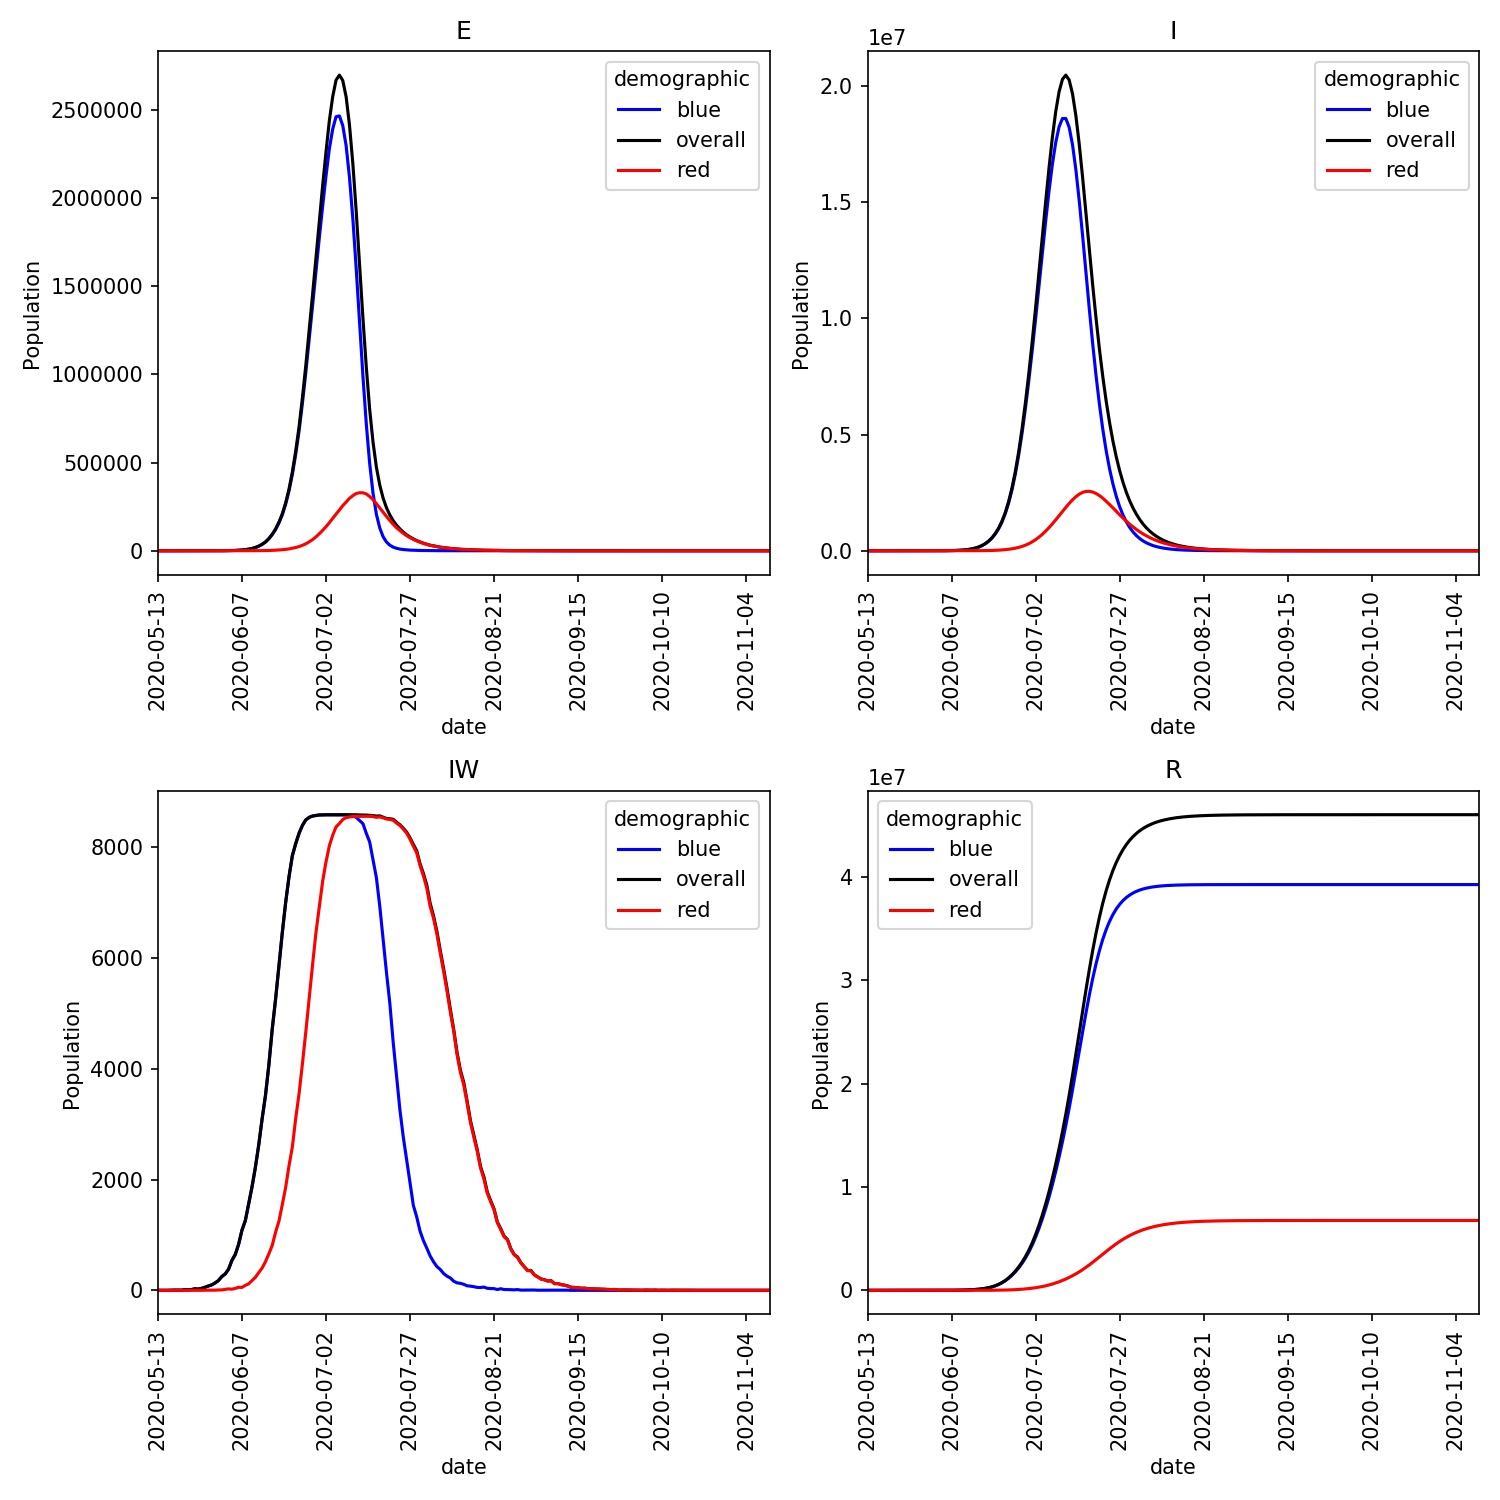
You should see that, while the infection moves through most of the blue demographic, it is relatively contained within the red demographic.
You can plot the trajectory using;
metawards-plot -i output/trajectory.csv.bz2
You should see a plot similar to this;
Adjusting shielding parameters
This has worked well, in that the shielded red demographic has been protected from the disease. However, using scaling factors of 0.2 and 0.1 is quite extreme, especially over the four months of the model outbreak.
We can use adjustable parameters to investigate how much shielding is
needed to protect the red demographic. To do this, update your
shield.py file to contain;
from metawards.mixers import merge_using_matrix

def mix_shield(network, **kwargs):
    params = network.params

    red_red = params.user_params["red_red"]
    red_blue = params.user_params["red_blue"]
    blue_red = params.user_params["blue_red"]
    blue_blue = params.user_params["blue_blue"]

    matrix = [ [red_red , red_blue ],
               [blue_red, blue_blue] ]

    network.demographics.interaction_matrix = matrix

    return [merge_using_matrix]
Here we have adapted our mix_shield function to get the values for
the interaction matrix from adjustable user parameters that have been
set using same mechanism as before.
In this case we have called the parameters red_red, for the impact
of red on red, red_blue for the impact of blue on red etc.
We then need to create an input file to set the initial values of these parameters. Create such a file called “shield.inp” and copy in;
.red_red   = 0.2
.red_blue  = 0.1
.blue_red  = 0.8
.blue_blue = 1.0
Finally, we would like to scan through the different value of
red_red and red_blue to see how much the red demographic
needs to be shielded. Create a scan file called scan.dat and copy in;
.red_red  .red_blue
   0.2       0.1
   0.2       0.2
   0.2       0.3
   0.2       0.4
   0.2       0.5

   0.3       0.1
   0.3       0.2
   0.3       0.3
   0.3       0.4
   0.3       0.5

   0.4       0.1
   0.4       0.2
   0.4       0.3
   0.4       0.4
   0.4       0.5

   0.5       0.1
   0.5       0.2
   0.5       0.3
   0.5       0.4
   0.5       0.5
This scans red_red between 0.2 and 0.5 while scanning red_blue
from 0.1 to 0.5
You can run these jobs using this command;
metawards -d lurgy3 -D demographics.json -a ExtraSeedsLondonBlue.dat --mixer shield --user-variables shield.inp -i scan.dat
or, alternatively if you have a cluster you could use a job script such as this to run multiple repeats (always a good idea for a stochastic simulation).
#!/bin/bash
#PBS -l walltime=12:00:00
#PBS -l select=4:ncpus=64:mem=64GB
# The above sets 4 nodes with 64 cores each

# Assume you have metawards in $HOME/envs/metawards
source $HOME/metawards/bin/activate

# change into the directory from which this job was submitted
cd $PBS_O_WORKDIR

metawards -u shield.inp -i scan.dat -d lurgy3 \
          -D demographics.json -a ExtraSeedsLondonBlue.dat \
          --mixer shield \
          --repeats 8 --nthreads 16 --force-overwrite-output
if you are using PBS, or
#!/bin/bash
#SBATCH --time=01:00:00
#SBATCH --ntasks=4
#SBATCH --cpus-per-task=64
# The above sets 4 nodes with 64 cores each

# Assume you have metawards in $HOME/envs/metawards
source $HOME/metawards/bin/activate

metawards -u shield.inp -i scan.dat -d lurgy3 \
          -D demographics.json -a ExtraSeedsLondonBlue.dat \
          --mixer shield \
          --repeats 8 --nthreads 16 --force-overwrite-output
This job may take a while (likely 1-2 minutes per model run, and then scaled by number of jobs divided by number of cores). In my case, this took about 16 minutes on 256 cores of Catalyst.
Once you have performed this calculation you can generate an animation of the overview graphs using;
metawards-plot -i output/results.csv.bz2
metawards-plot --animate output/overview*.jpg -o output/overview.gif
(assuming all of your output is in the output directory)
Your animation should look something like this;
You can also generate the individual demographic trajectory overview plots and animate those using;
metawards-plot -i output/*x001/trajectory.csv.bz2
metawards-plot --animate output/*x001/demographics.jpg -o output/demographics.gif
Note
We’ve only generated and animated the first repeat here (directories are all named “SOMETHINGx001”). This makes processing quicker and the resulting animation smaller, as each repeat has almost the same plot.
Your animation should look something like this;
From this scan it is clear that the red-blue scale has a much bigger
impact on the success of shielding than red-red.
This suggests, at least in this model,
that it is more important for the blue demographic to take care when
interacting with the red demographic than it is to control the level
of lockdown of the red demographic.