Mixers and Merge-functions
In the last page you modelled outbreaks that were seeded either in the red population, who were all players, and the blue population, which contained both players and all of the workers.
This resulted in two different outbreaks, which was understandable given that only workers move between wards. One issue was that the demographics were completely separate - infected individuals in the red population couldn’t infect individuals in the blue population and vice-versa.
This is because the Network for each demographic was
advanced independently, and no mixing took place.
Force of infection (FOI)
Infected individuals in a ward contribute to the force of infection (FOI) of that ward. The higher the FOI, the more likely it is that other individuals in a ward will become infected.
The FOIs for each demographic sub-network are calculated independently,
based only on the infected individuals from that demographic. We can thus
use the FOI calculation as a way of enabling different demographics to
mix. We do this in metawards using custom functions, called
MetaWards.mixers. These choose different
merge functions that are
used to mix and merge calculations of FOIs across different demographics.
The default mixer is mix_none(), which, as the
name suggests, performs no mixing between demographics.
Mix evenly
An alternative is to use mix_evenly(). This evenly
mixes all demographics. It sets the FOI in each ward in each demographic
equal to the sum of the FOIs in that ward across all demographics.
You can choose this mixer using the --mixer argument. Run metawards
using;
metawards -d lurgy3 -D demographics.json -a ExtraSeedsLondon.dat --mixer mix_evenly
You should now see that the outbreak spreads from the initial infection in the red demographic to the blue workers, who then spread it around the country to both the red and blue groups.
The trajectories for each of the demographics are written into a single
csv file called output/trajectory.csv.bz2. This can be loaded
into tools such as Excel, R or Pandas for detailed analysis. For example,
in Pandas you can load the file using;
>>> import pandas as pd
>>> df = pd.read_csv("output/trajectory.csv.bz2")
>>> print(df)
      day        date demographic         S  E  I         R  IW
 0      0  2020-05-07     overall  56082077  0  0         0   0
 1      0  2020-05-07         red  16806501  0  0         0   0
 2      0  2020-05-07        blue  39275576  0  0         0   0
 3      1  2020-05-08     overall  56082077  0  0         0   0
 4      0  2020-05-08         red  16806501  0  0         0   0
 ..   ...         ...         ...       ... .. ..       ...  ..
 388    0  2020-09-13         red   1609032  0  0  15197469   0
 389    0  2020-09-13        blue   1101473  0  1  38174102   0
 390  130  2020-09-14     overall   2710505  0  0  53371572   0
 391    0  2020-09-14         red   1609032  0  0  15197469   0
 392    0  2020-09-14        blue   1101473  0  0  38174103   0

 [393 rows x 8 columns]
You can see that the values for each day for each demographic are printed
in turn. The column called demographic holds the name of the demographic,
with the overall total network called overall.
You can plot this data easily using metawards-plot, e.g.
metawards-plot -i output/trajectory.csv.bz2
This will produce a graph called output/demographics.jpg.
This should look similar to this;
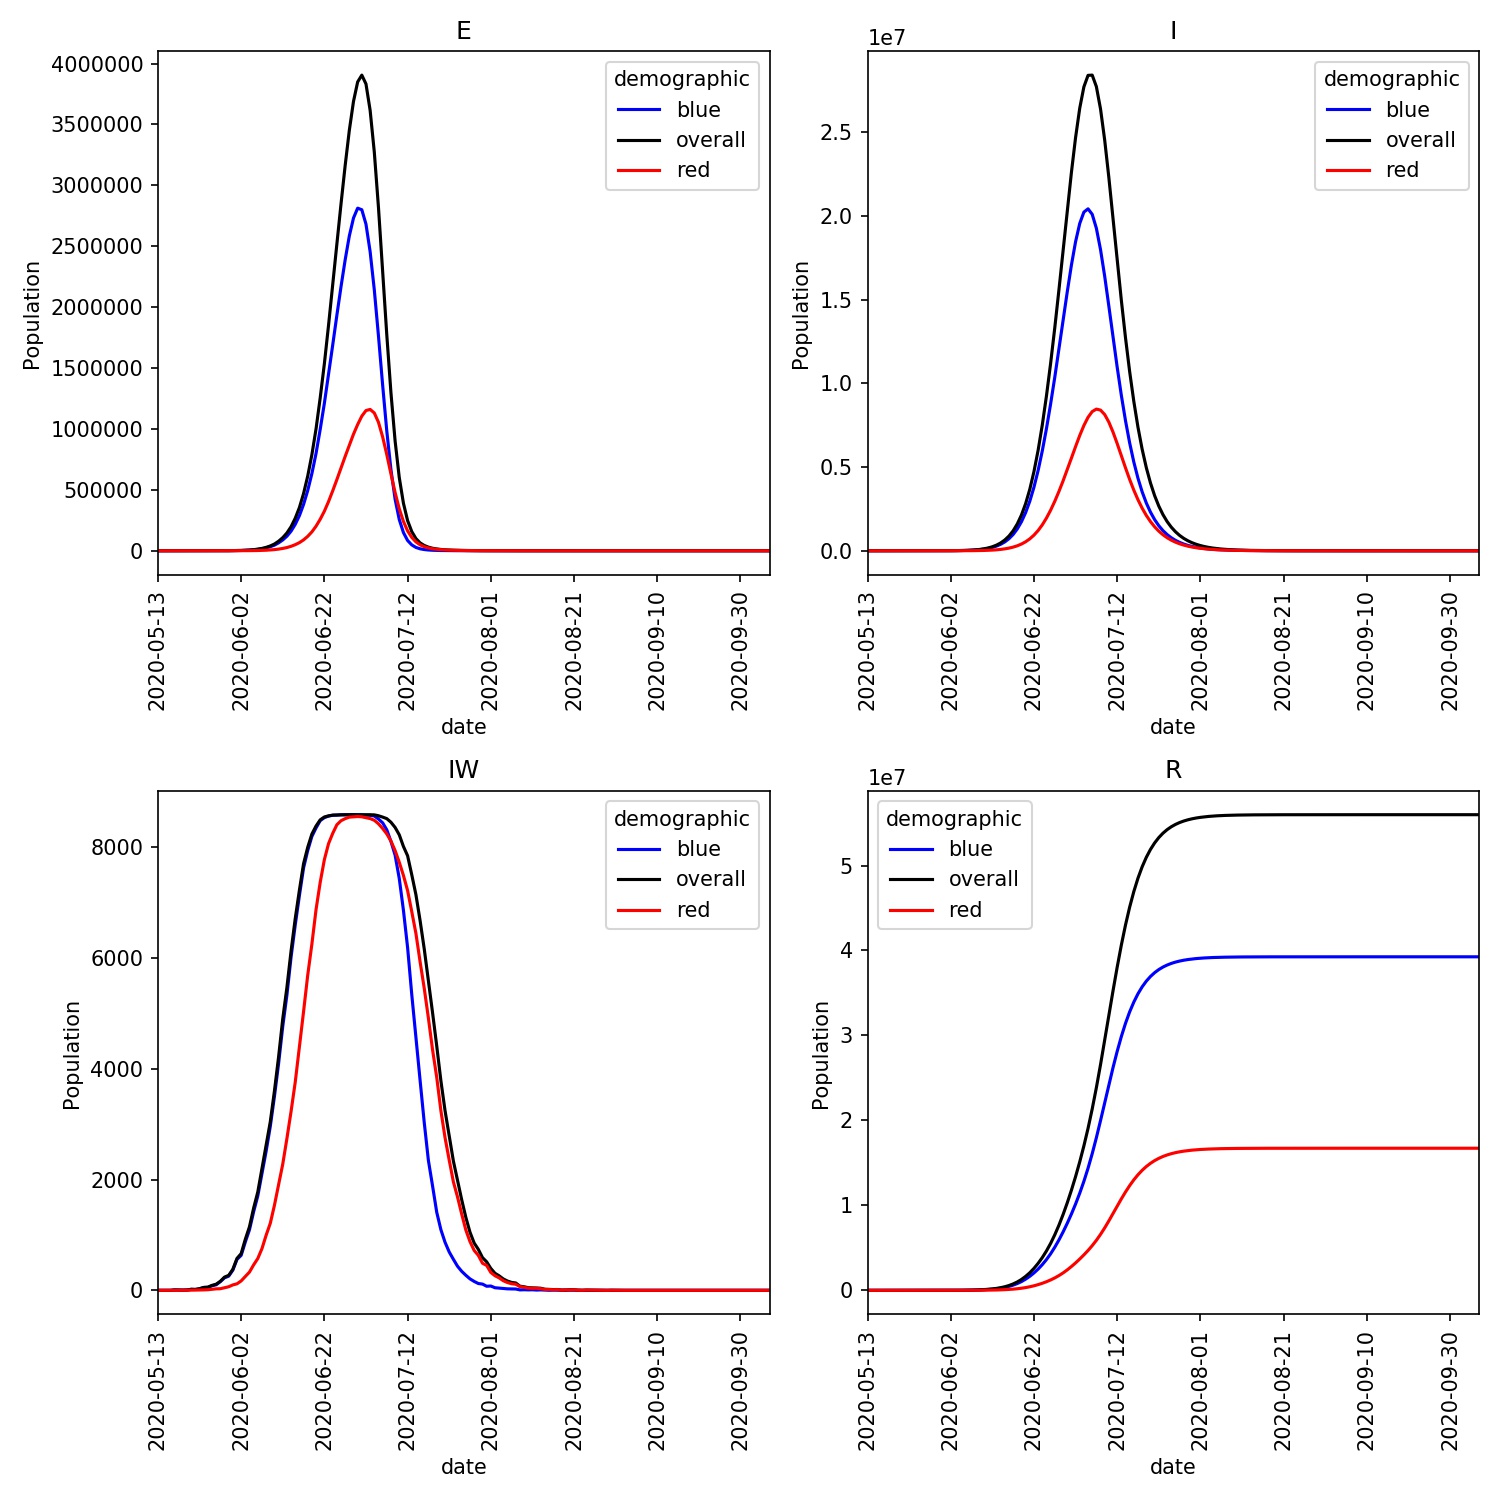
Notice how infections in the red demographic lag behind those of the blue demographic. This makes sense, as it is only the workers from the blue demographic that can be infected outside their home ward. The blue workers are thus the source of the infection for the red demographic.