Conditional Compliance
In the last section we saw that self-isolation will only work if individuals self-isolate at an early stage of the lurgy, and for 5-7 days.
However, that model and conclusion is flawed. The model assumed that everyone who had reached the self-isolation stage would elect to self-isolate, and would remain their for the full required duration.
Unfortunately, this is not realistic. Many individuals would not self-isolate, e.g. because they don’t feel that ill, don’t recognise the symptoms, have financial or social pressures to keep going out etc. Equally, many may break quarantine early, if they feel better or more mobile.
To model this, we need to conditionally send only a percentage of individuals into self-isolation. And then, for each day quarantine, we need to release an increasing percentage back to their normal behaviour.
Moving a fraction of individuals
Both the go_isolate() and
go_to() go functions accept the fraction
keyword argument. This argument sets the percentage (or fraction)
of the population who should move. By default this is 1.0 (representing
100%). This fraction is used to sample a random number of individuals
according to a binomial distribution.
We can adjust this value to examine impact of reduced self-isolation compliance on the outbreak.
To do this, update your move_isolate.py move function to;
from metawards import Population
from metawards import Networks
from metawards.movers import go_isolate, go_to

def move_isolate(network: Networks, population: Population, **kwargs):
    ndays = 7
    isolate_stage = 3
    compliance_fraction = 0.5

    day = population.day % ndays
    isolate = f"isolate_{day}"

    go_isolate_day = lambda **kwargs: go_isolate(
                                        go_from="home",
                                        go_to=isolate,
                                        self_isolate_stage=isolate_stage,
                                        fraction=compliance_fraction,
                                        **kwargs)

    go_released = lambda **kwargs: go_to(go_from=isolate,
                                        go_to="released",
                                        **kwargs)

    return [go_released, go_isolate_day]
Here we have added compliance_fraction, set to 0.5 to represent,
on average, to 50% of individuals complying with the need to go into
self-isolation. This fraction is passed as fraction to the
go_isolate function.
Run metawards using;
metawards -d lurgy4 -D demographics.json -a ExtraSeedsLondon.dat --mixer mix_isolate --mover move_isolate --nsteps 365
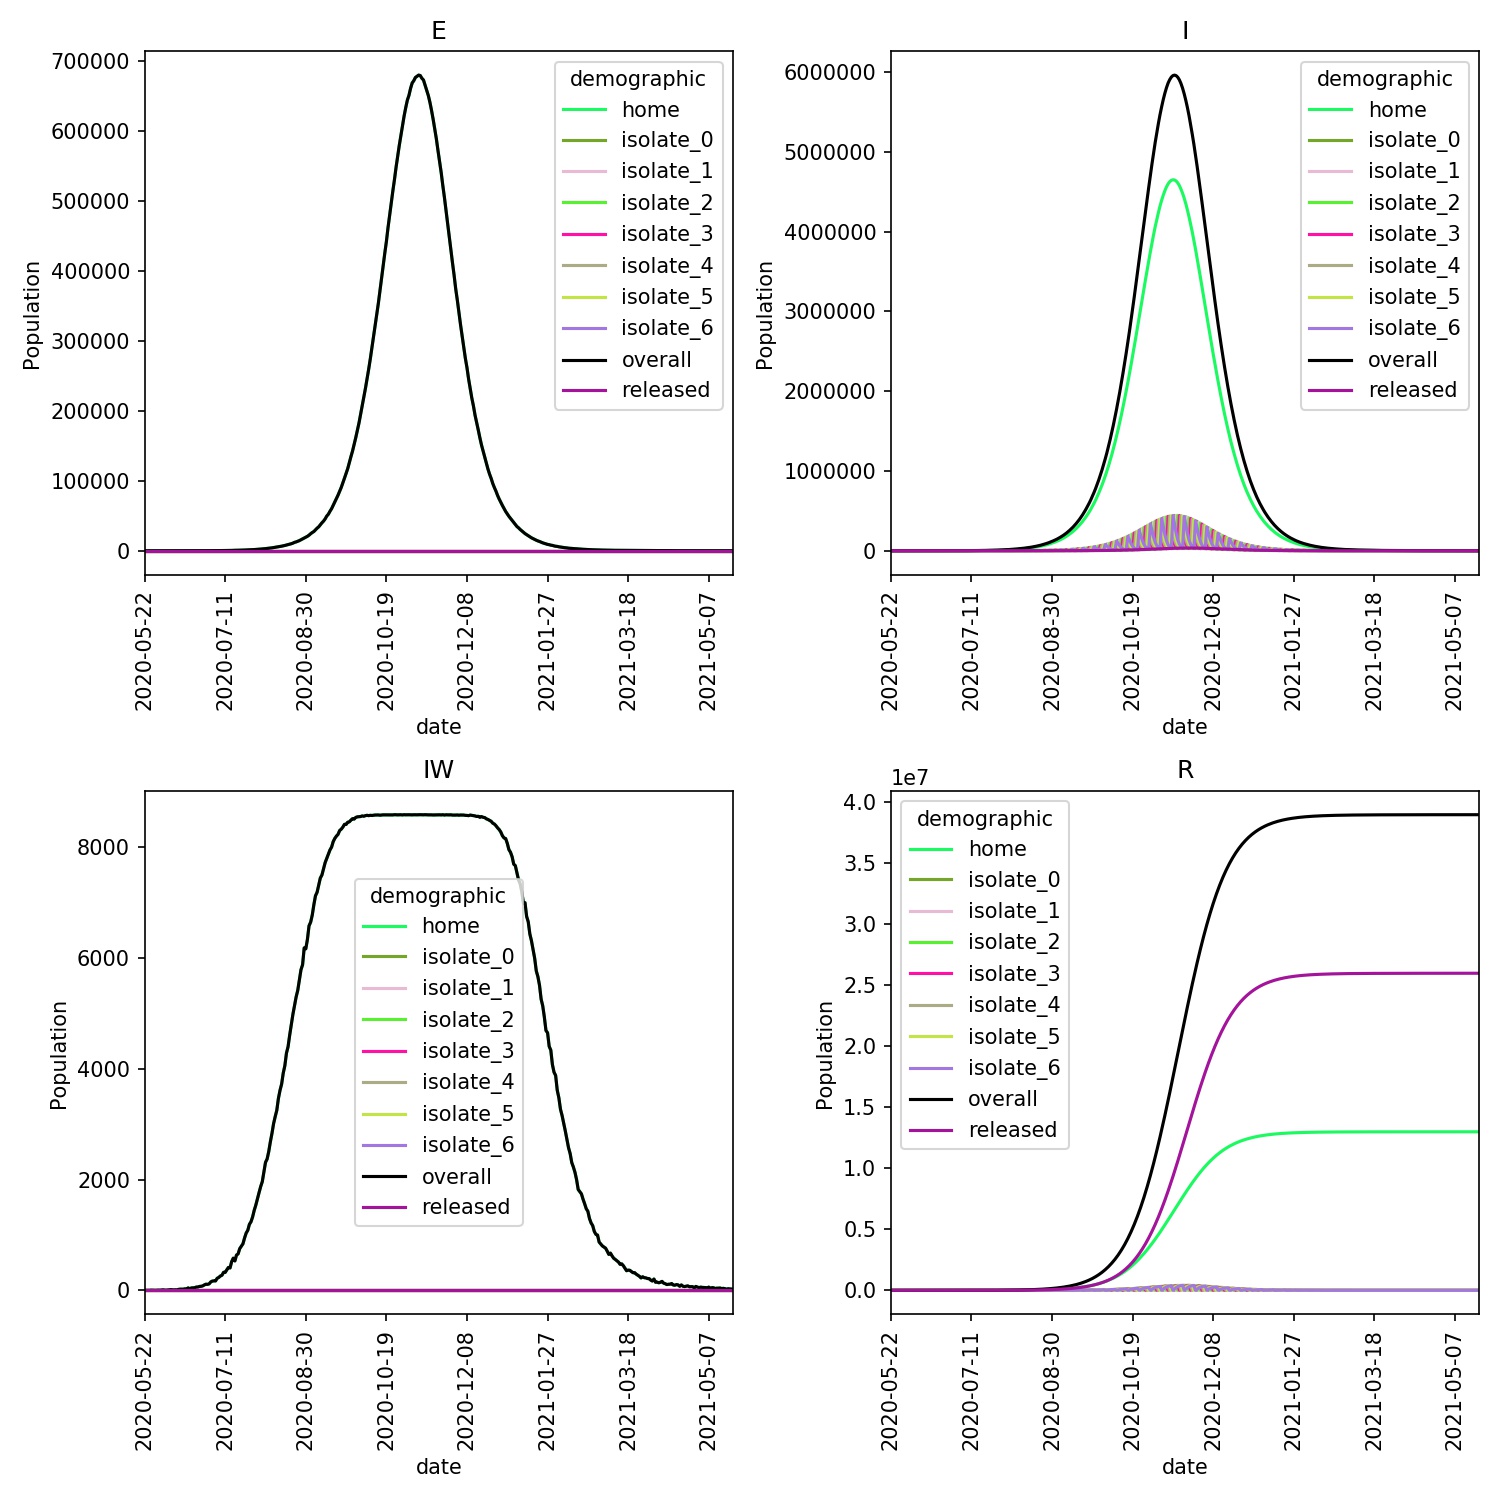
You should see that infection spreads quickly, as the 50% of individuals who
each day decide not to self-isolate from stage 2 of the lurgy infect the
susceptible population. The outbreak should end with approximately
two thirds of those infected recovering in released (and so had
isolated), and one third recovering in home (having never isolated).
A plot of the the demographics shows this more clearly;
metawards-plot -i output/trajectory.csv.bz2
Scanning compliance
We can investigate the effect of different levels of compliance by
scanning through compliance_fraction. Update your move_isolate.py
to read;
from metawards import Population
from metawards import Networks
from metawards.movers import go_isolate, go_to

def move_isolate(network: Networks, population: Population, **kwargs):
    user_params = network.params.user_params

    ndays = 7
    isolate_stage = 3
    compliance_fraction = user_params["compliance"]

    day = population.day % 7
    isolate = f"isolate_{day}"

    go_isolate_day = lambda **kwargs: go_isolate(
                                        go_from="home",
                                        go_to=isolate,
                                        self_isolate_stage=isolate_stage,
                                        fraction=compliance_fraction,
                                        **kwargs)

    go_released = lambda **kwargs: go_to(go_from=isolate,
                                        go_to="released",
                                        **kwargs)

    return [go_released, go_isolate_day]
The only change here is that we now set compliance_fraction from the
compliance user defined parameter.
Now create a scan file called scan_compliance.dat that contains;
.compliance
    1.00
    0.95
    0.90
    0.85
    0.80
    0.75
    0.70
    0.65
    0.60
    0.55
    0.50
This scans compliance from 1.00 to 0.50 in increments of 0.05.
This is the command to run a single scan locally;
metawards -d lurgy4 -D demographics.json -a ExtraSeedsLondon.dat --mixer mix_isolate --mover move_isolate --extractor extract_none --nsteps 365 -i scan_compliance.dat
You will likely need a cluster to perform repeats, so here is a suitable PBS and slurm job file;
#!/bin/bash
#PBS -l walltime=12:00:00
#PBS -l select=4:ncpus=64:mem=64GB
# The above sets 4 nodes with 64 cores each

source $HOME/envs/metawards/bin/activate

# change into the directory from which this job was submitted
cd $PBS_O_WORKDIR

metawards -d lurgy4 -D demographics.json -a ExtraSeedsLondon.dat \
        --mixer mix_isolate --mover move_isolate --extractor extract_none \
        --nsteps 365 -i scan_compliance.dat --repeats 8 \
        --nthreads 16 --force-overwrite-output --no-spinner --theme simple
#!/bin/bash
#SBATCH --time=01:00:00
#SBATCH --ntasks=4
#SBATCH --cpus-per-task=64
# The above sets 4 nodes with 64 cores each

source $HOME/envs/metawards/bin/activate

metawards -d lurgy4 -D demographics.json -a ExtraSeedsLondon.dat \
        --mixer mix_isolate --mover move_isolate --extractor extract_none \
        --nsteps 365 -i scan_compliance.dat --repeats 8 \
        --nthreads 16 --force-overwrite-output --no-spinner --theme simple
You can generate an overview animation using;
metawards-plot -i output/results.csv.bz2
metawards-plot --animate output/overview*
The resulting animation should look like this;
From this it is clear the high compliance with self-isolation is needed to prevent a large-scale outbreak. You can see exactly the effect by plotting the average number of recovereds as a function of the level of compliance at the end of the year (365 days). This can be done in Python pandas, R or Excel. For example, here is how you would make this plot in pandas;
>>> import pandas as pd
>>> import matplotlib as mpl
>>> df = pd.read_csv("output/results.csv.bz2")
>>> day_365 = df[df["day"] == 365]
>>> day_365_mean = day_365.groupby("fingerprint").mean()
>>> ax = day_365_mean.plot.line(x=".compliance", y="R")
>>> ax.yaxis.set_major_formatter(mpl.ticker.StrMethodFormatter('{x:,.0f}'))
>>> fig = ax.get_figure()
>>> fig.tight_layout()
>>> fig.savefig("compliance.jpg")
The figure I get is shown here;
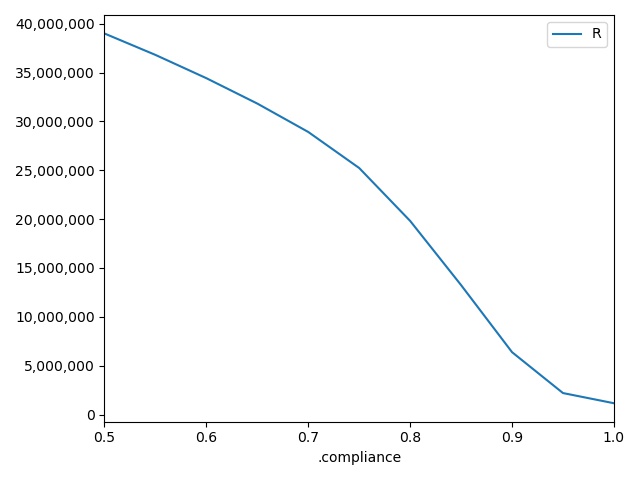
For the lurgy, compliance of 90% still leads to ~6 million infections over the year, while compliance of 80% leads to ~20 million. If compliance drops to 50%, then ~39 million individuals are infected.