Refining the disease model
In the last part of the tutorial you plotted graphs that showed the progress of the lurgy across four model runs of the outbreak which were seeded in London.
While this was good, the model runs were performed using an initial,
possibly poor model of the lurgy. Our next step is to customise the
disease file to build a more representative model.
Understanding the disease file
The model of the lurgy is based on the disease file contained in the MetaWardsData repository.
The first step to customise this file is to copy it into our current
directory and rename it to lurgy2.json.
Assuming you have set the METAWARDSDATA environment
variable equal to the path to this directory, type;
cp $METAWARDSDATA/diseases/lurgy.json ./lurgy2.json
on Linux or Mac OS X, or type;
copy $Env:METAWARDSDATA\diseases\lurgy.json lurgy2.json
on Windows.
Note
The above command work on Linux, Mac (OS X) or Windows. If you are following this tutorial using a different operating system and know the correct copy command to use, then please send it to us by sending us a pull request or posting an issue.
The disease file for the lurgy looks like the following;
{ "name"             : "The Lurgy",
  "version"          : "April 16th 2020",
  "author(s)"        : "Christopher Woods",
  "contact(s)"       : "christopher.woods@bristol.ac.uk",
  "reference(s)"     : "Completely ficticious disease - no references",
  "beta"             : [0.0, 0.0, 0.5, 0.5, 0.0],
  "progress"         : [1.0, 1.0, 0.5, 0.5, 0.0],
  "too_ill_to_move"  : [0.0, 0.0, 0.5, 0.8, 1.0],
  "contrib_foi"      : [1.0, 1.0, 1.0, 1.0, 0.0]
}
The file is in JSON format. This is easy for computers to read, and relatively easy for us to read too ;-)
Notice that the file contains metadata, e.g. version, author(s), references that embed some extra context into where the data for this file comes from. Feel free to edit the file and add your metadata.
The key parameters for the disease are the set of numbers associated with beta, progress, too_ill_to_move and contrib_foi.
These lists provide the values for those parameters in the model for the different stages of the disease. In this case, the lurgy has five stages (also called classes). An individual who is infected progresses along each stage (or class) in turn according to the value of the parameters;
beta - the rate of infection of the disease. For the first two stages the value of beta is zero, meaning that infected individuals are not infectious. However, individuals are infectious in stages three and four, when beta is 0.5. The final fifth stage is when the individual is removed from the outbreak, when the beta value is zero again.
progess - rate of progression of an individual through the stages of the disease. Individuals progress quickly through the first two stages (where progress is 1.0), and then progress slows down in the third and fourth stages (progress is 0.5). The fifth stage is the final stage, and so the progress value is zero.
too_ill_to_move - the proportion of infected individuals who are unable to move. This starts low in the initial stages, e.g. at stage three individuals can move (too_ill_to_move is 0.5) and are quite infectious (beta is 0.5). This progresses up to 1.0 for the final stage, when the individual is removed from the oubreak.
contrib_foi - this is how much the infected individuals contribute to the force of infection in their home electoral ward or during their work commute. In this case, individuals infected with this model lurgy contribute fully (contrib_foi is 1.0) for all but the final stage, when they are removed from the outbreak.
Modifying the disease file
With the current model, the lurgy only becomes infectious when
the infected individual are already showing symptoms and have
reduced mobility. For the lurgy that we want to model we need to
represent the lurgy as a disease that is infectious for a period
of time before the individual is showing symptoms. To this end,
we will an extra stage in the middle for which beta is high
but too_ill_to_move is still zero. Edit your copy of
lurgy2.json to read;
{ "name"             : "The Lurgy",
  "version"          : "April 16th 2020",
  "author(s)"        : "Christopher Woods",
  "contact(s)"       : "christopher.woods@bristol.ac.uk",
  "reference(s)"     : "Completely ficticious disease - no references",
  "beta"             : [0.0, 0.0, 0.5, 0.5, 0.5, 0.0],
  "progress"         : [1.0, 1.0, 1.0, 0.5, 0.5, 0.0],
  "too_ill_to_move"  : [0.0, 0.0, 0.0, 0.5, 0.8, 1.0],
  "contrib_foi"      : [1.0, 1.0, 1.0, 1.0, 1.0, 0.0]
}
Once you have saved the file you can perform a single model run using this file via;
metawards -d lurgy2 -a ExtraSeedsLondon.dat
Note
metawards automatically used your lurgy2.json file as it
found the file in your current directory. You can pass a full path to
your file, with or without the .json extension
This will run the metawards model run for your new version of the
lurgy. Notice that near the top of the output you have your parameters
and the metadata printed to the screen, e.g.
━━━━━━━━━━━━━━━━━━━━━━━━━━━━━━━━━━━━━━━━ Disease ━━━━━━━━━━━━━━━━━━━━━━━━━━━━━━━━━━━━━━━━━

• Disease: lurgy2
• loaded from: lurgy2.json
• repository: /Users/chris/GitHub/MetaWardsData
• repository_branch: None
• repository_version: None
• beta: [0.0, 0.0, 0.5, 0.5, 0.5, 0.0]
• progress: [1.0, 1.0, 1.0, 0.5, 0.5, 0.0]
• too_ill_to_move: [0.0, 0.0, 0.0, 0.5, 0.8, 1.0]
• contrib_foi: [1.0, 1.0, 1.0, 1.0, 1.0, 0.0]
• start_symptom: 3
Again, this helps someone reproduce this output in the future.
This model run may take longer, as, intuitively, you would expect that the changes we have made mean that more individuals are likely to be infected. Indeed, for the run I performed, copied below, the outbreak lasted for 196 days, involving nearly 50m individuals.
━━━━━━━━━━━━━━━━━━━━━━━━━━━━━━━━━━━━━━━━ Day 189 ━━━━━━━━━━━━━━━━━━━━━━━━━━━━━━━━━━━━━━━━━
S: 6225870  E: 1  I: 3  R: 49856203  IW: 0  POPULATION: 56082077
Number of infections: 4

━━━━━━━━━━━━━━━━━━━━━━━━━━━━━━━━━━━━━━━━ Day 190 ━━━━━━━━━━━━━━━━━━━━━━━━━━━━━━━━━━━━━━━━━
S: 6225870  E: 0  I: 2  R: 49856205  IW: 0  POPULATION: 56082077
Number of infections: 2

━━━━━━━━━━━━━━━━━━━━━━━━━━━━━━━━━━━━━━━━ Day 191 ━━━━━━━━━━━━━━━━━━━━━━━━━━━━━━━━━━━━━━━━━
S: 6225870  E: 0  I: 2  R: 49856205  IW: 0  POPULATION: 56082077
Number of infections: 2

━━━━━━━━━━━━━━━━━━━━━━━━━━━━━━━━━━━━━━━━ Day 192 ━━━━━━━━━━━━━━━━━━━━━━━━━━━━━━━━━━━━━━━━━
S: 6225870  E: 0  I: 2  R: 49856205  IW: 0  POPULATION: 56082077
Number of infections: 2

━━━━━━━━━━━━━━━━━━━━━━━━━━━━━━━━━━━━━━━━ Day 193 ━━━━━━━━━━━━━━━━━━━━━━━━━━━━━━━━━━━━━━━━━
S: 6225870  E: 0  I: 2  R: 49856205  IW: 0  POPULATION: 56082077
Number of infections: 2

━━━━━━━━━━━━━━━━━━━━━━━━━━━━━━━━━━━━━━━━ Day 194 ━━━━━━━━━━━━━━━━━━━━━━━━━━━━━━━━━━━━━━━━━
S: 6225870  E: 0  I: 2  R: 49856205  IW: 0  POPULATION: 56082077
Number of infections: 2

━━━━━━━━━━━━━━━━━━━━━━━━━━━━━━━━━━━━━━━━ Day 195 ━━━━━━━━━━━━━━━━━━━━━━━━━━━━━━━━━━━━━━━━━
S: 6225870  E: 0  I: 1  R: 49856206  IW: 0  POPULATION: 56082077
Number of infections: 1

━━━━━━━━━━━━━━━━━━━━━━━━━━━━━━━━━━━━━━━━ Day 196 ━━━━━━━━━━━━━━━━━━━━━━━━━━━━━━━━━━━━━━━━━
S: 6225870  E: 0  I: 0  R: 49856207  IW: 0  POPULATION: 56082077
Number of infections: 0
Infection died ... Ending on day 197
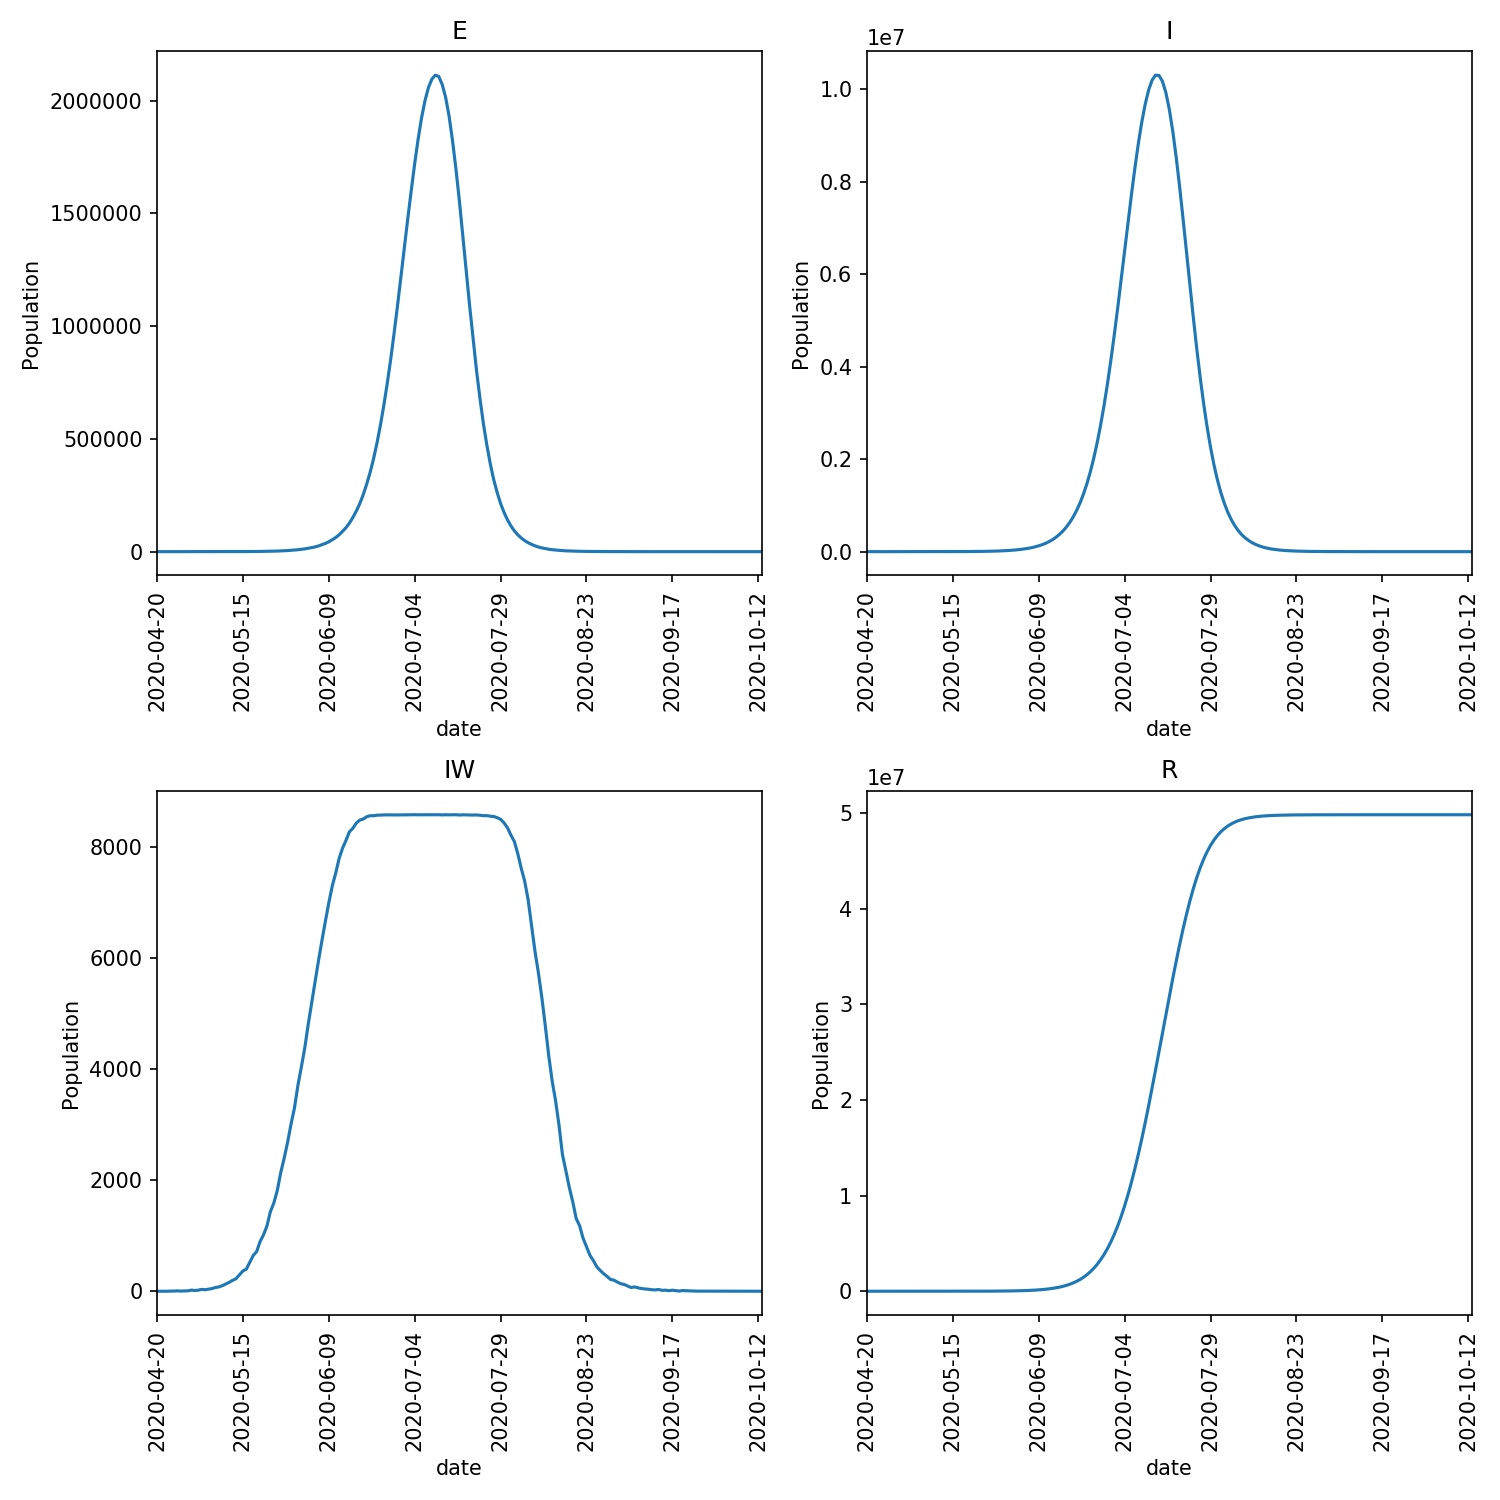
An overview plot of the outbreak, created using
metawards-plot -i output/results.csv.bz2
shows the much higher peak of the outbreak compared to our original model of the lurgy.