Refining the model
You have now run a large number of repeats of lots of different combinations of the beta and too_ill_to_move disease parameters of your model of the lurgy.
Looking at the results, it is clear the greater the value of beta, the larger the outbreak. This makes sense, as beta controls the the rate of infection.
The interpretation for too_ill_to_move is less clear. It doesn’t immediately seem to have a big impact on the size or duration of the infection.
Testing a hypothesis
One hypothesis why this was the case is because the progress parameter, which represents the rate at which individuals move through our new stage of the lurgy, was 1.0. This meant that individuals in the model did not spend long in the infectious (beta == 1.0) but mobile and symptom-free (too_ill_to_move == 0.0) state.
The hypothesis is that decreasing the rate at which individuals move through this state should increase the outbreak as they will have more time to unknowingly spread the infection.
To test this hypothesis, we can create a new set of adjustable variables in which we vary progress as well as beta and too_ill_to_move.
Setting up the job
Create a new directory on your cluster and copy in your lurgy2.json
disease file. Then create a new script called create_params.py and
copy into this;
import sys

b0 = float(sys.argv[1])
b1 = float(sys.argv[2])
bdel = float(sys.argv[3])

i0 = float(sys.argv[4])
i1 = float(sys.argv[5])
idel =float(sys.argv[6])

p0 = float(sys.argv[7])
p1 = float(sys.argv[8])
pdel = float(sys.argv[9])

print("beta[2]  too_ill_to_move[2]  progress[2]")

b = b0
while b <= b1:
    i = i0
    while i <= i1:
        p = p0
        while p <= p1:
            print("  %.2f     %.2f    %.2f" % (b, i, p))
            p += pdel

        i += idel
    b += bdel
Run this script using;
python create_params.py 0.4 0.71 0.1 0.0 0.5 0.1 0.2 0.81 0.2 > lurgyparams.csv
This will create a set of adjustable variable sets for model runs that vary beta between 0.4 and 0.7 in steps of 0.1, too_ill_to_move between 0.0 and 0.5 in steps of 0.1, and progress between 0.2 and 0.8 in steps of 0.2.
The first few lines of this file are shown below;
beta[2]  too_ill_to_move[2]  progress[2]
  0.40     0.00    0.20
  0.40     0.00    0.40
  0.40     0.00    0.60
  0.40     0.00    0.80
  0.40     0.10    0.20
  0.40     0.10    0.40
  0.40     0.10    0.60
  0.40     0.10    0.80
  0.40     0.20    0.20
Note
The file is space-separated, so it is not a problem that the columns don’t line up with their titles. With a little more python you could make them line up. What approach would you take?
Running the job
You can now submit this job using a copy of the job script that you used before. For example, I used;
#!/bin/bash
#PBS -l walltime=12:00:00
#PBS -l select=4:ncpus=64:mem=64GB

# source the version of metawards we want to use
source $HOME/envs/metawards-devel/bin/activate

# change into the directory from which this job was submitted
cd $PBS_O_WORKDIR

export METAWARDS_CORES_PER_NODE="64"
export METAWARDSDATA="$HOME/GitHub/MetaWardsData"

metawards --additional ExtraSeedsLondon.dat \
          --disease lurgy2.json \
          --input lurgyparams.csv --repeats 16 --nthreads 8 \
          --force-overwrite-output
I submitted usig the command;
qsub jobscript.sh
Processing the output
The job will take a while. In my case, the job took 2 hours to run.
Once complete, the results.csv.bz2 file contains all of the
population trajectories and can be analysed in an identical way
as before. If you want, you can
my results.csv.bz2 file here.
You can then produce graphs and animations using;
metawards-plot -i output/results.csv.bz2 --format jpg --dpi 150
metawards-plot --animate output/overview*.jpg
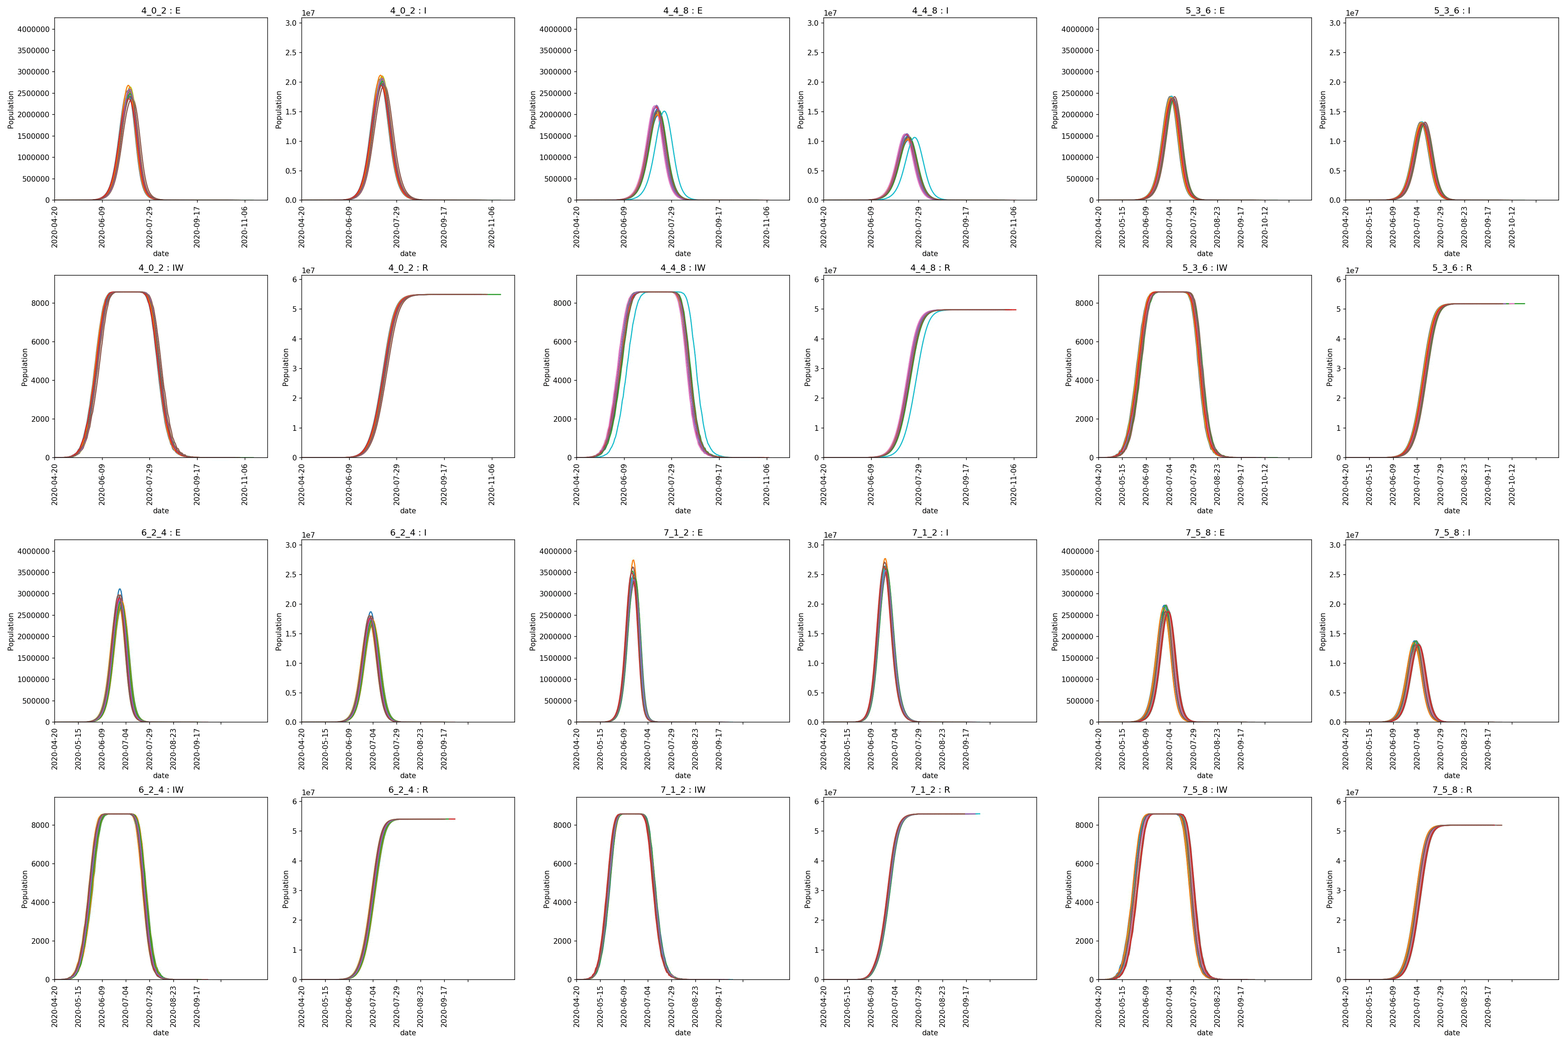
The resulting animation of the overview plots is shown below.

Conclusion from experiment
It is clear from these graphs that the rate of progress through the new stage of the lurgy we added has an impact on the form of the outbreak. The lower value of progress in the new infectious and asymptomatic stage leads to a wider outbreak that moves more quickly through the population.
The (fictional) lurgy is a mild and mildly infectious disease that doesn’t
cause too many symptoms. From the graphs, it is clear that this is best
modelled using a low value of beta and a low value of progress
for the new stage we added. We will leave the value of
too_ill_to_move at 0.0 to capture asymptomatic nature of this
stage. With this choice made,
please create a new version of the lurgy disease parameters called
lurgy3.json and copy in the below;
{ "name"             : "The Lurgy",
  "version"          : "April 17th 2020",
  "author(s)"        : "Christopher Woods",
  "contact(s)"       : "christopher.woods@bristol.ac.uk",
  "reference(s)"     : "Completely ficticious disease - no references",
  "beta"             : [0.0, 0.0, 0.4, 0.5, 0.5, 0.0],
  "progress"         : [1.0, 1.0, 0.2, 0.5, 0.5, 0.0],
  "too_ill_to_move"  : [0.0, 0.0, 0.0, 0.5, 0.8, 1.0],
  "contrib_foi"      : [1.0, 1.0, 1.0, 1.0, 1.0, 0.0]
}
Once you have this, verify that you can run a metawards simulation,
and then plot the graphs using;
metawards -d lurgy3.json --additional ExtraSeedsLondon.dat
metawards-plot -i output/results.csv --format jpg --dpi 150
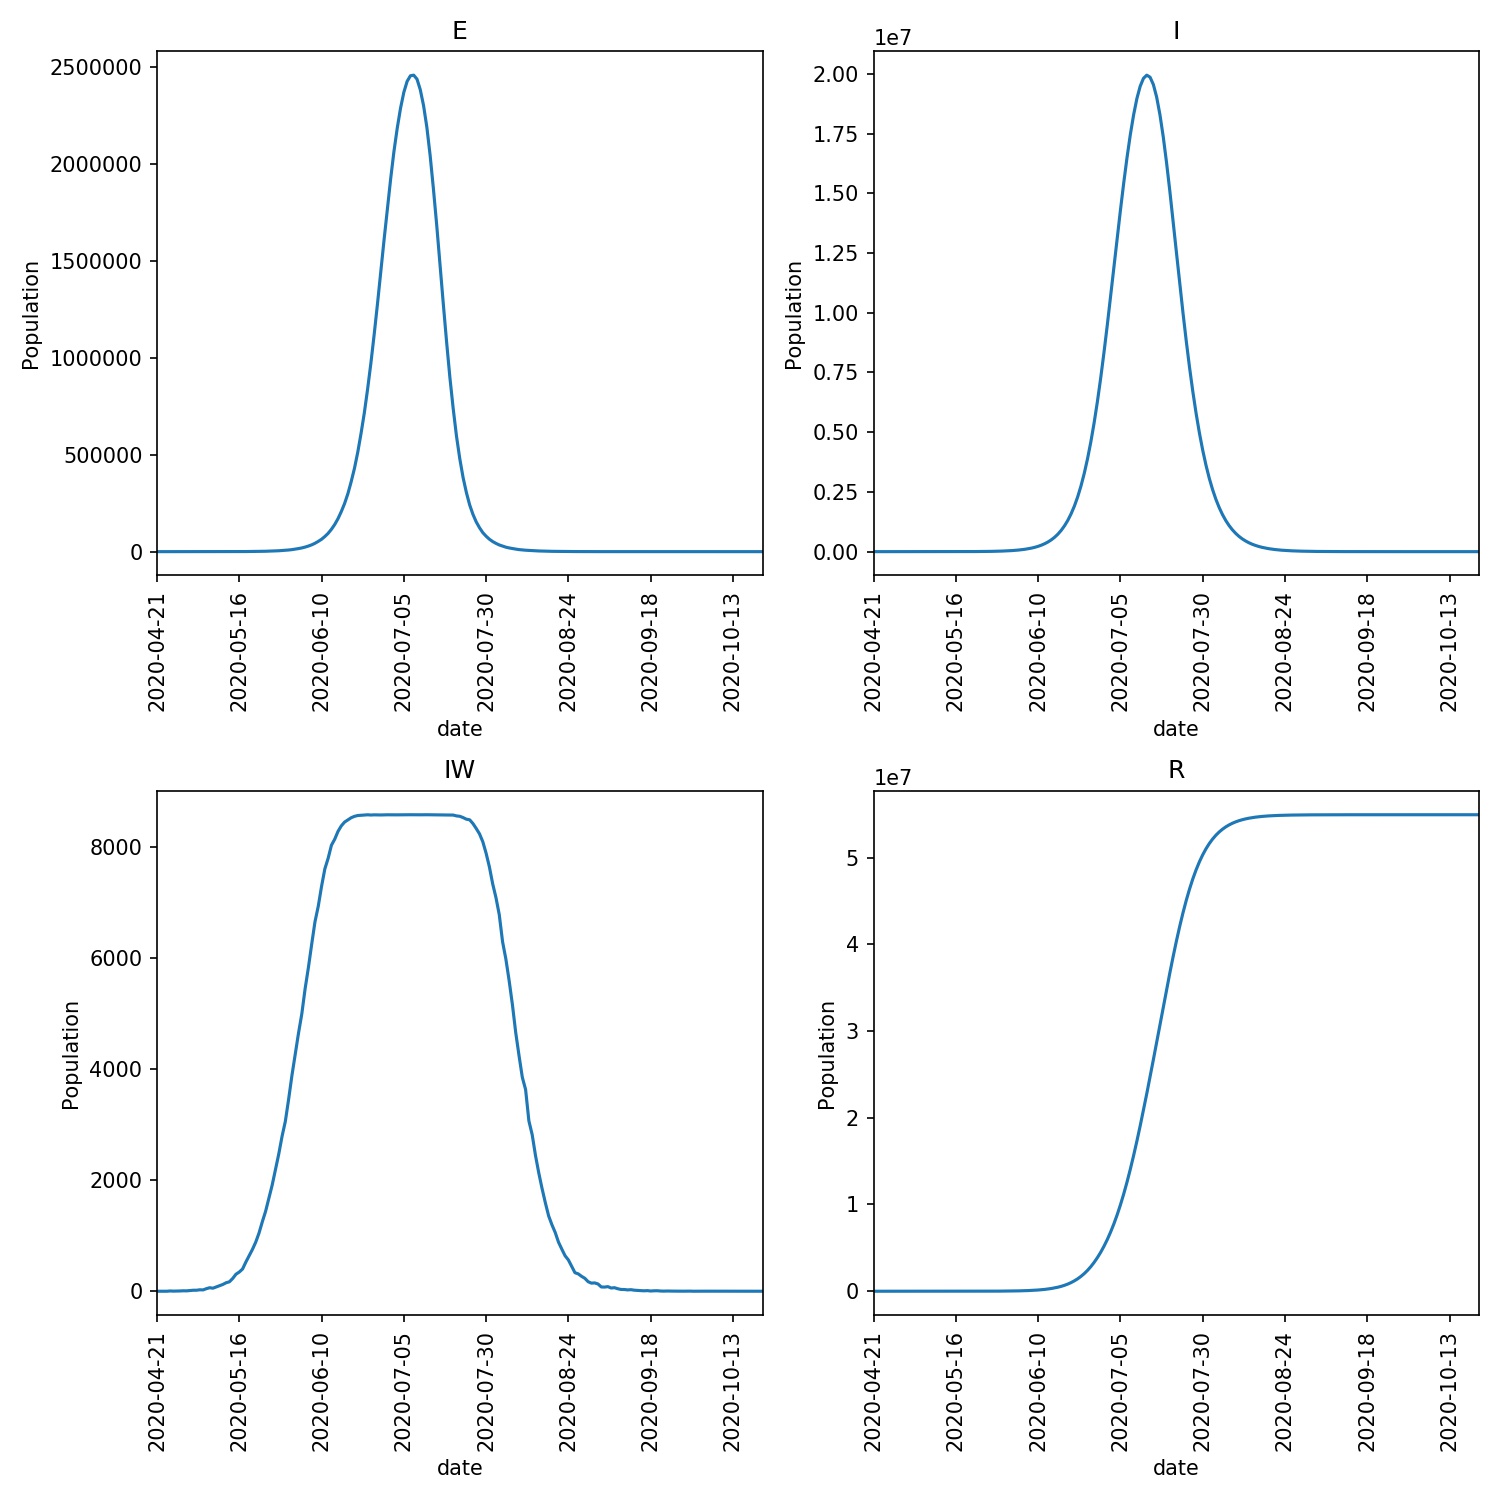
If it works, then you should obtain a graph that looks something like this;

Warning
Remember that this is a completely fictional disease and is not related to any real outbreak. The graphs above are purely illustrative and chosen so that people following this tutorial can quickly see the impact of their work.