Modelling the ICU
We have modelled the hospital as single patient population. However, for a small proportion of cases, we need to model an extra stage in the hospital for patients that need to go to the intensive care unit (ICU).
We will use the H2 state to model this. We will model that 10%
of patients in the H2 state go to the H2 state of an ICU
demographic, while the remainder are immediately moved back home
to the R state, as they will have recovered from the disease.
To do this, modify your demographics.json file to read;
{
    "demographics" : ["home", "staff", "patients", "icu"],
    "work_ratios"  : [ 0.99,   0.01,     0.00,     0.00 ],
    "play_ratios"  : [ 1.00,   0.00,     0.00,     0.00 ],
    "diseases"     : [ null,   null,   "lurgy_hospital", "lurgy_hospital" ]
}
Note
Now you can see the reason for the H2 state - it is being used to
model the ICU. Using two states like this enables us to use the
same lurgy_hospital disease file to model the hospital.
Next, we need to modify the mix_hospital.py to read;
from metawards.mixers import merge_using_matrix

def mix_shield(network, **kwargs):
    matrix = [ [1.0, 1.0, 0.0, 0.0],
               [0.0, 0.1, 0.1, 0.1],
               [0.0, 0.1, 0.0, 0.0],
               [0.0, 0.1, 0.0, 0.0] ]

    network.demographics.interaction_matrix = matrix

    return [merge_using_matrix]
Note
The only change here is adding in the fourth row and column for the ICU population. They don’t contribute to the FOI of each other, other patients or home, but can infect and be infected by the hospital staff.
Note
Note that we are using merge_using_matrix().
This may not be the right choice depending on how we want the
population dynamics to mix, e.g.
merge_matrix_single_population() or
merge_matrix_multi_population() may
be a better choice. See here for more information.
Next we need to modify extract_hospital.py to obtain the ICU
statistics. Edit the file and copy in the below;
from metawards.extractors import extract_default


def output_patients(network, population, workspace, output_dir, **kwargs):
    # Open the file "patients.csv" in the output directory,
    # using the supplied headers for the columns
    FILE = output_dir.open("patients.csv",
                           headers=["day", "H1", "H2", "ICU"],
                           sep=",")

    # Now get the workspace for the "patients" demographic
    index = network.demographics.get_index("patients")
    subspace = workspace.subspaces[index]

    # The total population at each infection stage is the sum
    # of the work and play infections
    inf_tot = [inf + pinf for inf, pinf in
               zip(subspace.inf_tot, subspace.pinf_tot)]

    H1 = inf_tot[2]
    H2 = inf_tot[3]

    # Now get the ICU demographic
    index = network.demographics.get_index("icu")
    subspace = workspace.subspaces[index]

    inf_tot = [inf + pinf for inf, pinf in
               zip(subspace.inf_tot, subspace.pinf_tot)]

    ICU = inf_tot[3]

    FILE.write(str(population.day) + ",")
    FILE.write(",".join([str(x) for x in [H1, H2, ICU]]) + "\n")


def extract_patients(**kwargs):
    # return all of the functions from "extract_default"
    # plus our new "output_i1"
    funcs = extract_default(**kwargs)
    funcs.append(output_patients)
    return funcs
Note
The change here is that we extract only H1 and H2 from the
patients demographic, before getting what we will call ICU
from the icu demographic.
Multiple go functions go home
Finally, we will now update the move_hospital.py file so that
we will have four “go functions”:
First we start with the function that moves 20% of the
`homeandstaffI2population toH1patients.Next, we move 10% of the
H2patientsto the same stage in theicudemographic. We will refer to this asICU.Next, we move the remainder of
H2patientstoRinhome, as these patients have now fully recovered and can go home.Finally, we move all
Rpatientsandicumembers toRinhomeas they have fully recovered and can go home.
You can implement this by editing your move_hospital.py file and
copying in the below;
from metawards.movers import go_stage


def move_hospital(**kwargs):
    # move 20% of I2 home/staff population to H1 patients
    func1 = lambda **kwargs: go_stage(go_from=["home", "staff"],
                                      go_to="patients",
                                      from_stage=4,
                                      to_stage=2,
                                      fraction=0.2,
                                      **kwargs)

    # move 10% of H2 patients to H2 ICU
    func2 = lambda **kwargs: go_stage(go_from="patients",
                                      go_to="icu",
                                      from_stage=3,
                                      to_stage=3,
                                      fraction=0.1,
                                      **kwargs)

    # move the remainder of H2 patients to home R
    func3 = lambda **kwargs: go_stage(go_from="patients",
                                      go_to="home",
                                      from_stage=3,
                                      to_stage=-1,
                                      fraction=1.0,
                                      **kwargs)

    # move R ICU and patients to home R
    func4 = lambda **kwargs: go_stage(go_from=["patients", "icu"],
                                      go_to="home",
                                      from_stage=-1,
                                      to_stage=-1,
                                      fraction=1.0,
                                      **kwargs)

    return [func1, func2, func3, func4]
You can then run metawards using the command;
metawards -D demographics.json -d lurgy4 --mixer mix_hospital --mover move_hospital --extract extract_hospital -a ExtraSeedsLondon.dat
You should see patients arriving in hospital, with some moving to the ICU. By the end of the outbreak everyone has recovered and has returned home.
You can plot the demographics trajectory using;
metawards-plot -i output/trajectory.csv.bz2
You should see a plot similar to this;
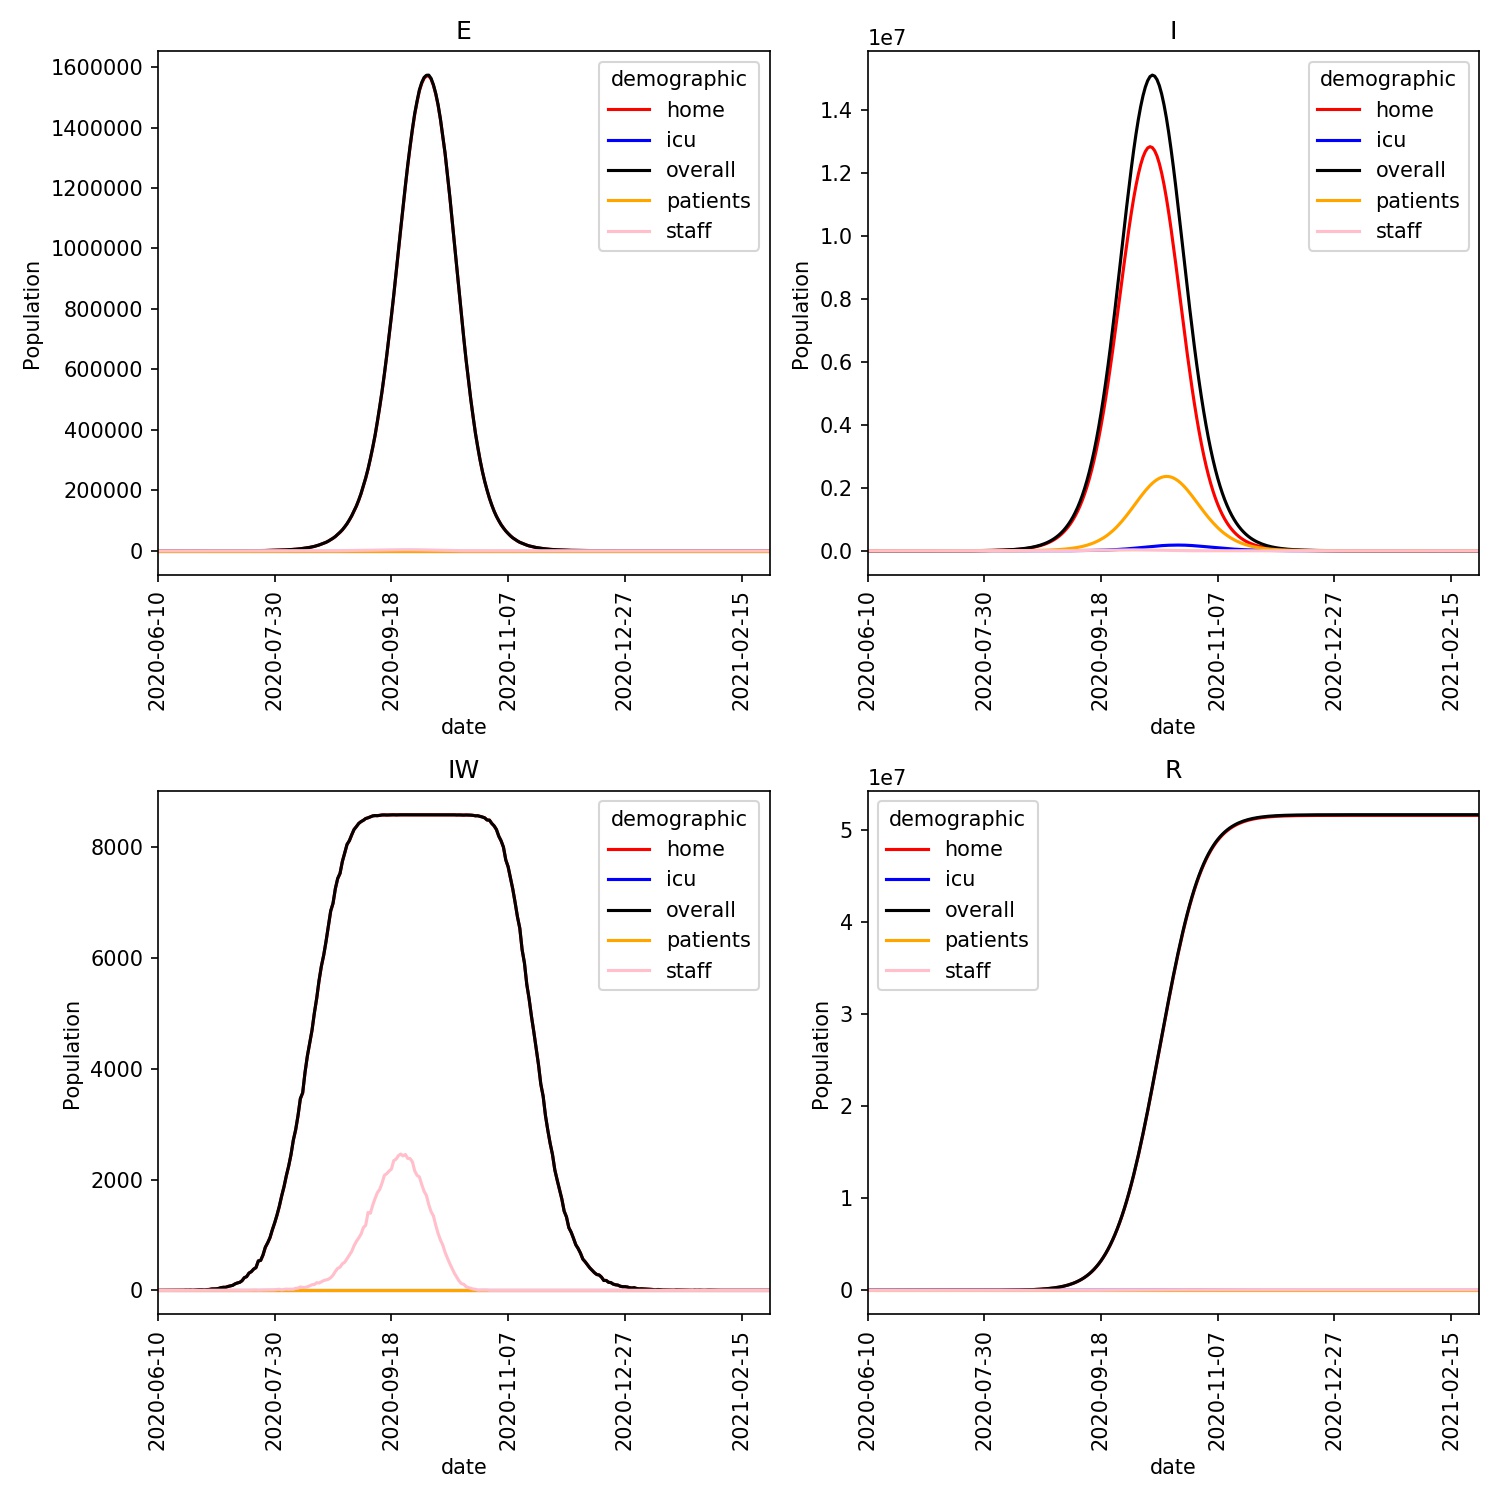
The ICU population is just visible on this plot, and is seen to lag behind
the patient population. You can see this more clearly by plotting the data
that was output to the output/patients.csv.bz2 file, e.g. using
pandas;
>>> import pandas as pd
>>> df = pd.read_csv("output/patients.csv.bz2")
>>> df.plot(x="day")
>>> import matplotlib.pyplot as plt
>>> plt.savefig("hospital.jpg")
You should see output something similar to this;
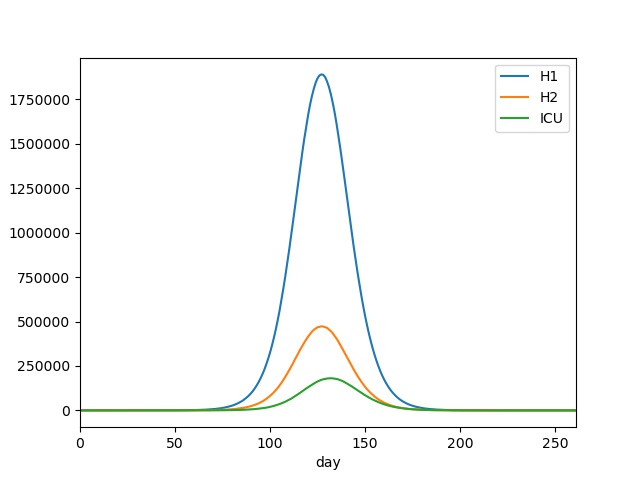
Similarly, we can extract the peak patient and ICU populations, via;
>>> import pandas as pd
>>> df = pd.read_csv("output/patients.csv.bz2")
>>> df[ df["H1"] == df["H1"].max() ]
     day       H1      H2     ICU
127  127  1890553  472957  172004
>>> df[ df["ICU"] == df["ICU"].max() ]
     day       H1      H2     ICU
132  132  1779346  445783  180845
This again shows that the time around 130 days since the start of the outbreak would be most challenging, with a peak of nearly 1.9 million normal patients, and over 180 thousand ICU patients.
Note that this is a very simplified model and data fitting would be
needed to optimise the various parameters (e.g. the interaction matrix
or the percentages of population who move from, e.g. H2 to ICU).
Also this is missing lots of other movements.
However, we hope that this gives you a good idea of how you can use demographics, mixing functions / interaction matrices, plus move functions to conditionally move to different disease stages in different demographics, to model a wide range of different scenarios.