Conditional Pathways
In the last example we saw how each demographic can be given a different disease pathway. In this section, we will see how to use move functions to move individuals between pathways. We did this before when we modelled quarantine. Now, we will see how, by using different disease stages, we can create a range of different pathways through which different individuals can conditionally progress.
Modelling a hospital
In this example we will create a model of a hospital. The demographics involved will be;
patients: Patients at the hospital who are infected with the lurgystaff: Hospital staff who care for the patientshome: The general population who are neither patients or staff
Members of the staff and home demographics will move along the
stages of the lurgy according to lurgy4.json. Hospital patients
will move through two hospital states, which we will refer to as
H1 and H2. These are defined in the file lurgy_hospital.json,
which you should create and copy in the below;
{ "name"             : "The Lurgy (hospital patients)",
  "version"          : "June 10th 2020",
  "author(s)"        : "Christopher Woods",
  "contact(s)"       : "christopher.woods@bristol.ac.uk",
  "reference(s)"     : "Completely ficticious disease - no references",
  "beta"             : [0.0, 0.0, 0.2, 0.2, 0.0],
  "progress"         : [1.0, 1.0, 0.2, 0.2, 0.0],
  "too_ill_to_move"  : [0.0, 0.0, 1.0, 1.0, 1.0],
  "contrib_foi"      : [0.0, 0.0, 1.0, 1.0, 0.0]
}
Note
Every disease must include the * and E stages, which are
stages 0 and 1, and the R stage which is the last stage. This
means that H1 and H2 are stages 2 and 3 in this file, both
of which have beta == 0.2, progress == 0.2 and
too_ill_to_move == 1.0. While the H1 and H2 stages
are identical now, we will look to change them later in this
tutorial.
The aim of the model will be that 20% of those suffering in the I2
stage of lurgy4.json will be moved to the H1 stage of
lurgy_hospital.json, and will then progress to H2 and then
R in the hospital.
We will next set that 1% of the worker population are hospital staff, while,
initially, nobody has the lurgy, and so there are no hospital patients.
We can set this using the file demographics.json, which you should
create and copy in the below;
{
    "demographics" : ["home", "staff", "patients"],
    "work_ratios"  : [ 0.99,   0.01,     0.00 ],
    "play_ratios"  : [ 1.00,   0.00,     0.00 ],
    "diseases"     : [ null,   null,   "lurgy_hospital" ]
}
Next, we need a mixing function that will model the interactions between hospital staff, patients and the general population. We will use the following interaction matrix;
home |
staff |
patients |
|
|---|---|---|---|
home |
1.0 |
1.0 |
0.0 |
staff |
0.0 |
0.1 |
0.1 |
patients |
0.0 |
0.1 |
0.0 |
This matrix sets that the home demographic is taking no precautions,
and are fully exposed to each other, and also fully exposed to members
of the staff demographic.
The staff demographic are taking lots of precautions, and are not
exposed to the home demographic, and only lightly exposed to other
staff or members of the patient demographic (matrix values
are 0.1).
Finally, the patients group are isolated from one another, and so
do not infect one another. At the moment this is moot, as all patients
in this model are already infected. However, you could add a susceptible
patient population who do not have the lurgy, and then use this final
element in the matrix to control the force of infection between patients.
Note
This is not an entirely realistic interaction matrix, but is set up
to demonstrate how the only route of infection of staff is from
patients.
To use this interaction matrix, create a mixer in mix_hospital.py
and copy in the below.
from metawards.mixers import merge_using_matrix

def mix_shield(network, **kwargs):
    matrix = [ [1.0, 1.0, 0.0],
               [0.0, 0.1, 0.1],
               [0.0, 0.1, 0.0] ]

    network.demographics.interaction_matrix = matrix

    return [merge_using_matrix]
Note
This is essentially an identical mixing function as that used in the shielding example.
Note
Note that we are using merge_using_matrix().
This may not be the right choice depending on how we want the
population dynamics to mix, e.g.
merge_matrix_single_population() or
merge_matrix_multi_population() may
be a better choice. See here for more information.
Next, we want to make sure that we have output the populations in the
H1 and H2 states. We can do this by creating a custom extractor
that writes the populations of all of the disease stages for just
the patients demographic to a file called patients.csv. To do this,
create the file extract_patients.py and copy in the below;
from metawards.extractors import extract_default


def output_patients(network, population, workspace, output_dir, **kwargs):
    # Open the file "patients.csv" in the output directory,
    # using the supplied headers for the columns
    FILE = output_dir.open("patients.csv",
                           headers=["day", "*", "E", "H1", "H2", "R"],
                           sep=",")

    # Now get the workspace for the "patients" demographic
    index = network.demographics.get_index("patients")
    subspace = workspace.subspaces[index]

    # The total population at each infection stage is the sum
    # of the work and play infections
    inf_tot = [inf + pinf for inf, pinf in
               zip(subspace.inf_tot, subspace.pinf_tot)]

    FILE.write(str(population.day) + ",")
    FILE.write(",".join([str(x) for x in inf_tot]) + "\n")


def extract_patients(**kwargs):
    # return all of the functions from "extract_default"
    # plus our new "output_patients"
    funcs = extract_default(**kwargs)
    funcs.append(output_patients)
    return funcs
Conditionally moving to hospital
The new part of this example is that we need to add a move function that
will move 20% of individuals who are in the I2 stage to
hospital, in the H1 stage. We can do this by writing a move function
into the file move_hospital.py, which you should create and
copy in the below;
from metawards.movers import go_stage


def move_hospital(**kwargs):
    func = lambda **kwargs: go_stage(go_from=["home", "staff"],
                                     go_to="patients",
                                     from_stage=4,
                                     to_stage=2,
                                     fraction=0.2,
                                     **kwargs)

    return [func]
This move function returns go_stage(). This is
very similar to go_to(), except you also specify
the from_stage and to_stage, which are the stage(s) to move from,
and the stage to move to. In this case, we will move 20% of individuals
from the I2
stage from the home and staff demographics, which is stage 4
of lurgy4.json. We will move these individuals to stage 2, which is
H2, in the patients demographic.
Now this is set, we can run the model using;
metawards -D demographics.json -d lurgy4 --mixer mix_hospital --mover move_hospital --extract extract_hospital -a ExtraSeedsLondon.dat
You should see that the epidemic starts in the home demographic, with
no infections in staff until after a number of the more ill home
individuals are moved to hospital as patients. In this model, the
~70,000 staff are overwhelmed with millions of patients. This means that,
despite their care, and the lack of interaction with home,
all of the members of the staff demographic become infected within
the first ~130 days of the epidemic.
You can plot this using the command;
metawards-plot -i output/trajectory.csv.bz2
The resulting plot should look something like this;
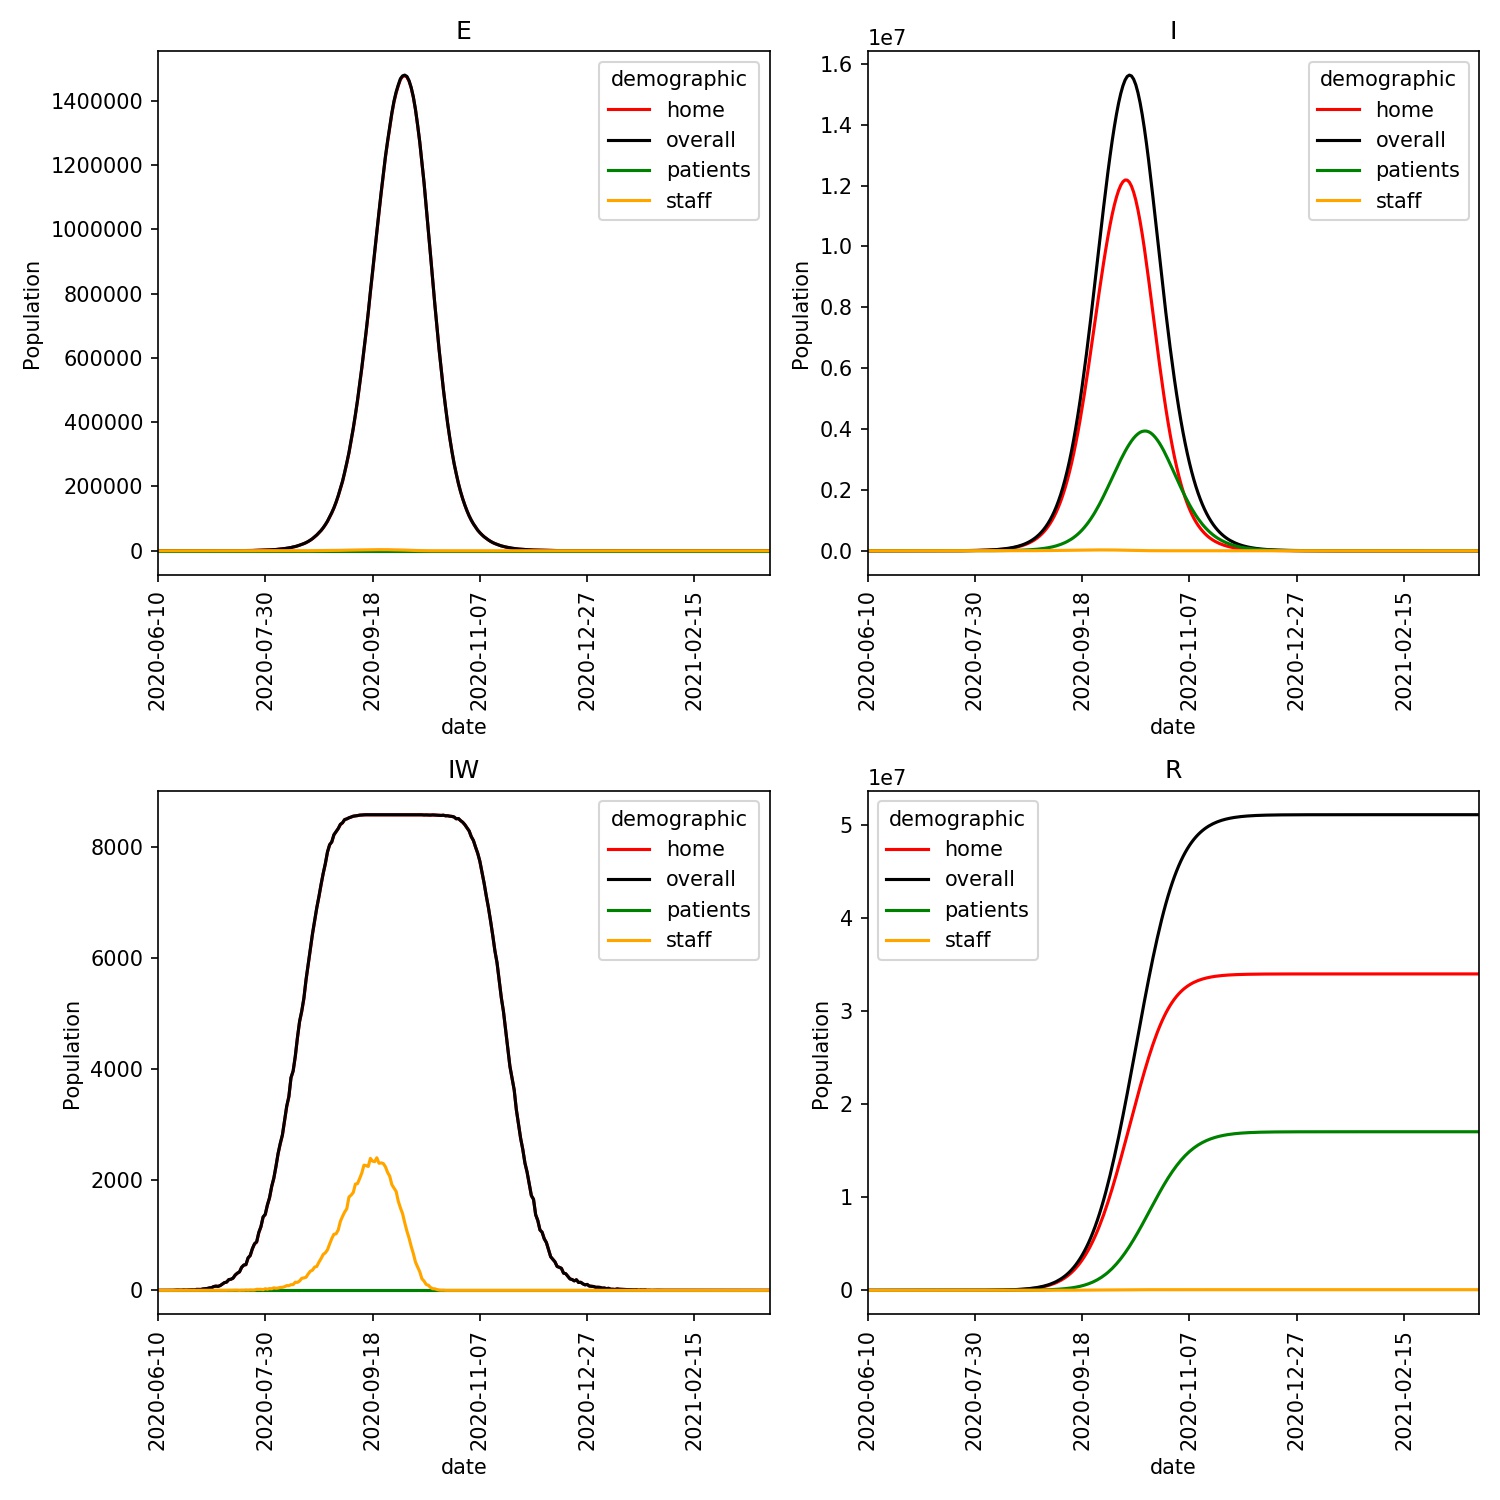
You can see that the infections for the patients lag behind that of the
general population, as individuals move to hospital at a late stage in the
disease, and then remain in hospital for a long time. You can also see
in the IW plot how the staff are quickly overwhelmed and are all
infected within ~4 months.
In addition to this plot, you will also see in the output directory
the patients.csv.bz2 file that was written by extract_patients.
We can load this into R, pandas or Excel to find the maximum occupancy
in the hospital for the two different stages.
>>> import pandas as pd
>>> df = pd.read_csv("output/patients.csv.bz2")
>>> df["H1"].max()
1799688
>>> df["H2"].max()
2166228
>>> df[ df["H1"] == df["H1"].max() ]
     day  *  E       H1       H2        R
126  126  0  0  1799688  2090894  6647271
>>> df[ df["H2"] == df["H2"].max() ]
     day  *  E       H1       H2        R
130  130  0  0  1742752  2166228  8348305
This shows that days 126-130 were particularly difficult, with nearly 4 million patients in hospital, while nearly all staff were infected.